
UNITED STATES
SECURITIES AND EXCHANGE COMMISSION
Washington, D.C. 20549
FORM
For the fiscal year ended
For the transition period from to
Commission file number:
(Exact name of small business issuer as specified in its charter)
|
||
(State or other jurisdiction of incorporation or organization) |
|
(IRS Employer Identification No.) |
|
||
(Address of principal executive offices)
|
||
( |
||
(Registrant’s telephone number) |
||
Securities registered under Section 12(b) of the Act: None
Title of each class |
|
Trading symbol |
|
Name of exchange on which registered |
|
|
OTCQB marketplace |
Indicate by check mark if the registrant is a well-known seasoned issuer, as defined in Rule 405 of the Securities Act. Yes ☐
Indicate by check mark if the registrant is not required to file reports pursuant to Section 13 or Section 15(d) of the Act. Yes ☐
Indicate by checkmark whether the registrant (1) has filed all reports required to be filed by Section 13 or 15(d) of the Securities Exchange Act of 1934 during the preceding 12 months (or for such shorter period that the registrant was required to file such reports), and (2) has been subject to such filing requirements for the past 90 days.
Indicate by check mark whether the issuer has submitted electronically every Interactive Data File required to be submitted pursuant to Rule 405 of Regulation S-T (§232.405 of this chapter) during the preceding 12 months (or for such shorter period that the registrant was required to submit such files).
Indicate by check mark whether the registrant is a large accelerated filer, an accelerated filer, a non-accelerated filer, a smaller reporting company, or an emerging growth company. See the definitions of “large accelerated filer,” “accelerated filer,” “smaller reporting company,” and “emerging growth company” in Rule 12b-2 of the Exchange Act.
Large accelerated filer ☐ Accelerated filer ☐
If an emerging growth company, indicate by check mark if the registrant has elected not to use the extended transition period for complying with any new or revised financial accounting standard provided pursuant to Section 13(a) of the Exchange Act. ☐
Indicate by check mark whether the registrant has filed a report on and attestation to its management’s assessment of the effectiveness of its internal control over financial reporting under Section 404(b) of the Sarbanes-Oxley Act (15 U.S.C. 7262(b)) by the registered public accounting firm that prepared or issued its audit report.
If securities are registered pursuant to Section 12(b) of the Act, indicate by check mark whether the financial statements of the registrant included in the filing reflect the correction of an error to previously issued financial statements.
Indicate by check mark whether any of those error corrections are restatements that required a recovery analysis of incentive-based compensation received by any of the registrant’s executive officers during the relevant recovery period pursuant to §240.10D-1(b). ☐
Indicate by check mark whether the registrant is a shell company (as defined in Rule 12b-2 of the Exchange Act). Yes ☐ No
State the aggregate market value of the voting and non-voting common equity held by non-affiliates computed by reference to the price at which the common equity was last sold, or the average bid and asked price of such common equity, as of the last business day of the registrant’s second fiscal quarter $
Indicate the number of shares outstanding of each of the registrant’s classes of common stock, as of the latest practicable date:
GALAXY GAMING, INC.
ANNUAL REPORT ON FORM 10-K FOR THE YEAR ENDED DECEMBER 31, 2024
TABLE OF CONTENTS
|
|
|
|
|
PART I |
||||
Item 1. |
|
|
|
4 |
Item 1A. |
|
|
8 |
|
Item 1B. |
|
|
10 |
|
Item 1C. |
|
|
10 |
|
Item 2. |
|
|
11 |
|
Item 3. |
|
|
11 |
|
Item 4. |
|
|
11 |
|
PART II |
||||
Item 5. |
|
Market for Registrant’s Common Equity and Related Stockholder Matters |
|
12 |
Item 7. |
|
Management’s Discussion and Analysis of Financial Condition and Results of Operations |
|
14 |
Item 7A. |
|
|
18 |
|
Item 8. |
|
Financial Statements and Supplementary Financial Information |
|
19 |
Item 9. |
|
Changes in and Disagreements with Accountants on Accounting and Financial Disclosure |
|
40 |
Item 9A. |
|
|
40 |
|
Item 9B. |
|
|
40 |
|
Item 9C. |
|
Disclosure Regarding Foreign Jurisdictions that Prevent Inspections |
|
40 |
PART III |
||||
Item 10. |
|
|
|
41 |
Item 11. |
|
|
44 |
|
Item 12. |
|
Security Ownership of Certain Beneficial Owners and Management, and Related Stockholder Matters |
|
50 |
Item 13. |
|
Certain Relationships and Related Transactions, and Director Independence |
|
51 |
Item 14. |
|
|
51 |
|
PART IV |
||||
Item 15. |
|
|
|
53 |
2
In this filing, we refer to: (i) our audited consolidated financial statements and notes thereto as our “Financial Statements,” (ii) our audited Consolidated Statements of Operations and Comprehensive Loss as our “Statements of Operations,” (iii) our audited Consolidated Balance Sheets as our “Balance Sheets,” (iv) our audited Consolidated Statements of Cash Flows as our “Statements of Cash Flows,” and (v) Item 7. Management’s Discussion and Analysis of Financial Condition and Results of Operations as our “Results of Operations.”
SPECIAL NOTE REGARDING FORWARD-LOOKING STATEMENTS
This Annual Report on Form 10-K (“Annual Report”) contains “forward-looking” statements within the meaning of Section 27A of the Securities Act of 1933, as amended (the “Securities Act”), Section 21E of the Securities Exchange Act of 1934, as amended (the “Exchange Act”), and the Private Securities Litigation Reform Act of 1995, as do other materials or oral statements we release to the public. Forward-looking statements are neither historical facts nor assurances of future performance, but instead are based only on our current beliefs, expectations, and assumptions regarding the future of our business, plans and strategies, projections, anticipated events and trends, the economy, and other future conditions, as of the date on which this report is filed. Forward-looking statements often, but do not always, contain words such as “may,” “will,” “should,” “could,” “might,” “expect,” “intend,” "target," “plan,” “anticipate,” “believe,” “estimate,” “predict,” “potential,” “continue,” or the negative of these terms or other similar expressions. These forward-looking statements are only predictions. We have based these forward-looking statements on our current expectations, assumptions and projections about future events and financial trends that we believe may affect our business, financial condition and results of operations. These forward-looking statements speak only as of the date of this Annual Report and are subject to a number of risks and uncertainties. These risks and uncertainties include, but are not limited to, the ability to complete the Merger (as defined herein) on the proposed terms or on the anticipated timeline, or at all, including risks and uncertainties related to securing the necessary stockholder approval, gaming regulatory approvals and satisfaction of other closing conditions to consummate the proposed Merger; the occurrence of any event, change or other circumstance that could give rise to the termination of the Merger Agreement (as defined herein); risks that the proposed Merger disrupts the Company’s (as defined herein) current plans and operations or diverts the attention of the Company’s management or employees from ongoing business operations; the risk that certain restrictions during the pendency of the Merger may impact the Company's ability to pursue certain business opportunities or strategic transactions; the risk of potential difficulties with the Company’s ability to retain and hire key personnel and maintain relationships with customers and other third parties as a result of the proposed Merger, including during the pendency of the Merger; the risk that the proposed Merger may involve unexpected costs and/or unknown or inestimable liabilities; the risk that the Company’s business may suffer as a result of uncertainty surrounding the proposed Merger; the risk that stockholder litigation in connection with the proposed Merger may affect the timing or occurrence of the proposed Merger or result in significant costs of defense, indemnification and liability; effects relating to the announcement of the proposed Merger or any further announcements or the consummation of the proposed Merger on the market price of the Company’s common stock or the Company’s operating results; the ability of Galaxy Gaming to enter and maintain strategic alliances, product placements or installations in land based casinos or grow its iGaming business, garner new market share, secure licenses in new jurisdictions or maintain existing licenses, successfully develop or acquire and sell proprietary products, comply with regulations, including changes in gaming related and non-gaming related statutes and regulations that affect the revenues of our customers in land-based casino and, online casino markets, have its games approved by relevant jurisdictions, unfavorable economic conditions in the US and worldwide, our level of indebtedness, restrictions and covenants in our loan agreement, dependence on major customers, protection of intellectual property and our ability to license the intellectual property rights of third parties, failure to maintain the integrity of our information technology systems, including without limitation, cyber-attacks or other failures in our telecommunications or information technology systems, or those of our collaborators, third-party logistics providers, distributors or other contractors or consultants, could result in information theft, data corruption and significant disruption of our business, and other factors. The events and circumstances reflected in our forward-looking statements may not be achieved or occur, and actual results could differ materially from those projected in the forward-looking statements. Except as required by applicable law, we do not plan to publicly update or revise any forward-looking statements contained herein, whether as a result of any new information, future events, changed circumstances or otherwise.
3
PART I
ITEM 1. BUSINESS
BUSINESS
Unless the context indicates otherwise, references to “Galaxy Gaming, Inc.,” “we,” “us,” “our,” or the “Company,” refer to Galaxy Gaming, Inc., a Nevada corporation (“Galaxy Gaming”).
We are an established global gaming company specializing in the design, development, acquisition, assembly, marketing and licensing of proprietary casino table games, side bets, and associated technology, platforms and systems for the casino and iGaming industries. Casinos use our proprietary products and services to enhance their gaming operations and improve their profitability and productivity, as well as to offer popular cutting-edge gaming entertainment content and technology to their players. We market our products and services to online and land-based casinos worldwide with products currently present in North America, the Caribbean, Central America, the United Kingdom, Europe, Africa, and to cruise ships exploring the world's oceans. We license our products and services for use in regulated land-based gaming markets. We also license our content and distribute content from other companies to iGaming operators in gaming markets throughout the world where iGaming is not illegal.
On July 18, 2024, we entered into an Agreement and Plan of Merger (the “Merger Agreement”) with Evolution Malta Holding Limited, a company registered in Malta (“Parent”), and Galaga Merger Sub, Inc., a Nevada corporation and direct wholly owned subsidiary of Parent (“Merger Sub”), pursuant to which, and subject to the terms and conditions thereof, Merger Sub would merge with and into the Company (the “Merger”), with the Company surviving the Merger as a wholly owned subsidiary of Parent.
Upon the closing of the Merger, each share of common stock, par value $0.001 per share of the Company issued and outstanding immediately prior to the effective time of the Merger, other than any Company common stock (i) owned by Company stockholders who are entitled to demand and have properly and validly demanded their appraisal rights under Nevada law or (ii) owned by Parent, Merger Sub, the Company or by any of their respective subsidiaries, will be converted automatically into the right to receive $3.20 per share in cash, without interest and subject to any applicable withholding taxes.
Consummation of the Merger is subject to the satisfaction or waiver of certain closing conditions, including approval by at least a majority of the voting power of the outstanding shares of the Company’s common stock of the Merger Agreement and the transactions contemplated thereby, including the Merger, and the receipt of certain gaming regulatory approvals. At the special meeting of the Company’s stockholders held on November 12, 2024, stockholders voted to approve the Merger. The Merger is expected to be completed in mid-2025, subject to satisfaction or waiver of the closing conditions. Upon completion of the Merger, the Company will become a privately held company and shares of Company’s common stock will no longer be listed on any public market.
Products and Services
We have two revenue streams which operate as a single reporting segment. In our GG Core revenue stream, we license our products to regulated terrestrial gaming establishments in the physical world (casinos, racinos, cruise ships, etc.) and to providers of gaming devices such as electronic table games (“ETG’s"). In our GG Digital revenue stream, we license our products to gaming establishments in the virtual world (online casinos and other gaming-related websites) where online gaming is not illegal.
Proprietary Table Games. Casinos use Proprietary Table Games together with or in lieu of other games in the public domain (e.g. Blackjack, Craps, Roulette, etc.) because of their popularity with players and to increase profitability. Typically, Proprietary Table Games are grouped into two product types referred to as “Side Bets” and “Premium Games.” Side Bets are proprietary features and wagering options typically added to public domain games such as baccarat, pai gow poker, craps and blackjack table games. Examples of our Side Bets include 21+3®, Lucky Ladies®, and Bonus Craps™. Premium Games are unique stand-alone games with their own set of rules and strategies. Examples of our Premium Games include Heads Up Hold ’em®, High Card Flush®, Cajun Stud®, Three Card Poker®, and EZ Baccarat. Generally, Premium Games generate higher revenue per table placement for us than do the Side Bet games.
Enhanced Table Systems. Enhanced Table Systems are electronic enhancements used on casino table games to add to player appeal and to enhance game security. An example in this category is our new Galaxy Operating System (“GOS”), an advanced electronic system installed on gaming tables designed to collect data by detecting player wagers and other game activities. This information is processed and used to improve casino operations by evaluating game play, to improve dealer efficiency and to reward players through the offering of jackpots and other bonusing mechanisms. Typically, the GOS system includes an electronic video display, marketed by Galaxy as the Lunar Table Display ("LTD"), which shows game information designed to generate player interest and to promote various aspects of the game. The GOS system can also be used to network numerous gaming tables together into a common system either within a casino or through the interconnection of multiple casinos. Our new systems utilize off-the-shelf computer hardware and are developed
4
using widely supported programming languages so as to be easily reviewable by the gaming laboratories that certify these types of products for use in casinos. Additionally, GOS also allows us to add new functionality as periodic releases without the need to replace the fundamental hardware or software supporting the platform.
Product Strategy. In the physical casino market, we have a “three-dimensional” growth strategy. First, we seek to increase the number of casinos we serve with our Proprietary Table Games and Enhanced Table Systems. Second, within a casino, we seek to increase the number of tables on which we have placements. Finally, by adding our enhanced systems to tables that already have our content, we can increase the billable units per table. For example, on a blackjack table that has one of our side bets, we can add a second side bet and a progressive jackpot for each side bet, thereby increasing the billable units for that table from one to four. Our current product placements are heavily concentrated around blackjack, and we have developed or licensed side bets and other game content to address other table game categories such as baccarat, roulette and craps.
iGaming Strategy. Our iGaming strategy is centered on maximizing content distribution across a wide array of online platforms. The iGaming content mirrors the offerings of land-based games and our customer in this channel base spans both business to consumer ("B2C") and business to business ("B2B") models. This dual approach enables us to forge direct partnerships with random number generator ("RNG") operators while also leveraging our global presence through B2B Live Dealer collaborations. In the digital gaming world, a "skin" refers to a uniquely branded and marketed casino URL. Operators often manage multiple skins to cater to diverse markets and themes. Our strategy focuses on expanding our content reach across as many skins as possible and maximizing the number of our games featured on each skin. Looking forward, we anticipate further legalization of online gaming across additional U.S. states, creating opportunities for our partners to engage a broader audience, however such expansion of iGaming is dependent on state and local legislators and regulators.
Recurring Revenue and Gross Profit
A majority of our clients contract with us to use our products and services on a month-to-month or annual basis with typically a 30–45 day termination notice requirement. We invoice our clients monthly, either in advance for unlimited use or in arrears for actual use, depending on the product or contract terms. Such recurring revenues accounted for substantially all of our total revenues in 2024. In 2023, we entered into perpetual license arrangements with a large customer where the customer paid an amount up front for hardware required to operate our products and to have a perpetual right to use our gaming systems. In 2024 and 2023, these perpetual license transactions accounted for 11% and 13%, respectively, of our total net revenues.
In general, our license revenues have few direct costs thereby generating high gross profit margins. We do not report “gross profit” in our statements of operations included in this report. Instead, gross profit would be comparable to “revenues” minus “cost of ancillary products and assembled components,” both of which are presented in our statements of operations. For the game content that we license from third parties, we pay royalties to game owners whose content we re-license to casino operators. Depending on the relationship between Galaxy and the licensor, those royalties are either deducted from gross revenue to arrive at net revenue or are included in operating expenses.
For more information about our revenues, operating income and assets, see “Item 7. Management’s Discussion and Analysis of Financial Condition and Results of Operations” and “Item 8. Financial Statements and Supplementary Financial Information” included in this report.
STRATEGY
Our long-term business strategy focuses on increasing our value to casino clients by offering them enhanced services and support, and by producing innovative products and game play methodologies that their players enjoy. We believe that by increasing the value of our products and services to clients, we can continue to build our recurring revenues in both existing and new markets. To achieve this objective, we employ the following strategies:
Expand our portfolio of services, products and technologies. Our strategy is to be an important vendor to casino operators by offering a complete and comprehensive portfolio of services, games, products, systems, technologies and methodologies for casino table games. We continuously develop and/or seek to acquire new proprietary table games to complement our existing offerings and to extend our
5
penetration of proprietary table games on the casino floor. We believe we have a significant opportunity to replicate the success we have had with blackjack side bets by developing content for the other significant public domain casino games of baccarat, roulette and craps.
Increase our per unit revenues by leveraging our Enhanced Table Systems. Our Enhanced Table Systems are placed on tables where we already have our side bet or premium game content deployed. By adding our Enhanced Table Systems, we increase the revenue we earn from that table. Gaming operators deploy the Enhanced Table Systems because they generally increase the win for the casino by an amount that significantly exceeds the cost to license the system from us. Our product strategy includes making Electronic Table Systems that support a multitude of side bets and premium games across several casino game segments (e.g., blackjack, craps, roulette, baccarat, etc.).
Expand the number of markets we serve. We have made continuous efforts to obtain licensure in new markets.
Grow our iGaming content and partner base. We intend to increase our revenues from iGaming in several ways. First, we expect that our existing licensees will see growth in their current markets while adding new markets in the U.S. and elsewhere. Second, we intend to add new licensees in the iGaming segment. And finally, we intend to add to the number of games that we license to both existing and new licensees.
Promote the use of our game content in adjacent gaming markets. We have proprietary table game content that is well-known and popular in physical casinos and online casinos. One example is the Electronic Table Games (“ETG”) market, which offers table game content on touch-screen video devices. As casinos face rising labor costs, traditional table games that require one or more physical dealers can become unprofitable at low bet minimums, and casinos expanded the use of ETGs to address this opportunity. Another example is lotteries (both ticket lotteries and iLotteries), where our well-known game content may attract patrons to lotteries as another way to enjoy it. There may be regulatory restrictions on the use of casino gaming content in certain lottery markets, but the addressable market is incremental even excluding these markets.
COMPETITION
We compete with several companies that develop and provide proprietary table games, electronic gaming platforms, game enhancements and related services. We believe that the principal competitive factors in our market include products and services that appeal to casinos and players, jurisdictional approvals and a well-developed sales and distribution network.
We believe that our success will depend upon our ability to remain competitive in our field. Competition can be based on price, brand recognition, player appeal and the strength of underlying intellectual property and superior customer service. Larger competitors may have longer operating histories, greater brand recognition, more firmly established supply relationships, superior capital resources, wider distribution channels and better product inventory than we do. Smaller competitors may be more able to participate in developing and marketing table games, compared to other gaming products, because of the lower cost and complexity associated with the development of these products and a generally less stringent regulatory environment. We compete with others in efforts to obtain or create innovative products, obtain financing, acquire other gaming companies, and license and distribute products. We compete on these bases, as well as on the strength of our sales, service and distribution channels.
Our land-based competitors include, but are not limited to, Light & Wonder, Inc.; International Game Technology; Play AGS, Inc.; TCS/John Huxley; Aces Up Gaming LLC; and Masque Publishing. Most of these competitors are larger than we are, have more financial resources than we do, have more business segments than we do, and have the ability to combine multiple products and provide discounts in connection with the combinations. In addition, we expect additional competitors to emerge in the future. There can be no assurances that we will be able to compete effectively in the future and failure to compete successfully in the market could have a material adverse effect on our business.
Unlike our land-based operations, we distribute iGaming content from competitors like AGS and select Light & Wonder offerings to partners worldwide. This approach has strengthened our position as a leading global distributor of table games content. To date, we have formed partnerships with some of the world’s largest gaming companies, including, but not limited to Evolution, Pragmatic Play, Playtech, SoftConstruct, Digitain, Bet365, Entain, Flutter, and DraftKings.
6
SUPPLIERS
We own the content for the majority of our Core Side Bets and Premium Games and we license some games from others, to whom we pay royalty fees when we license those games to others (including in the online gaming sector). We generally have multi-year licensing agreements for this content. With respect to our Enhanced Table Systems, we obtain most of the parts for our products from third-party suppliers, including both off-the-shelf items as well as components manufactured to our specifications. We also assemble a small number of parts in-house that are used both for product assembly and for servicing existing products. We generally perform warehousing, quality control, final assembly and shipping functions from our facilities in Las Vegas, Nevada, although small inventories are maintained, and repairs are performed by our remote field service employees.
In our iGaming business, we license some of our game content from third-party providers for re-licensing to online operators along with the content we own outright. We pay royalties to the owners of the content that we license from them.
RESEARCH AND DEVELOPMENT
We seek to develop and maintain a robust pipeline of new products and services to bring to market. We employ a staff of hardware and software engineers, graphic artists and game developers at our corporate offices to support, improve and upgrade our products and to develop and explore other potential table game products, technologies, methodologies and services. We also will use outside services for research and development from time to time.
INTELLECTUAL PROPERTY
Our products and the intellectual property associated with them are typically protected by patents, trademarks, copyrights and non-compete agreements. However, there can be no assurance that the steps we have taken to protect our intellectual property will be sufficient. Further, in the United States certain court rulings may make it difficult to enforce patents around the math relating to casino games, which makes us more dependent on copyrights and trademarks for protection. In addition, the laws of some foreign countries do not protect intellectual property to the same extent as the laws of the United States, which could increase the likelihood of infringement. Furthermore, other companies could develop similar or superior products without violating our intellectual property rights. If we resort to legal proceedings to enforce our intellectual property rights, the proceedings could be burdensome, disruptive, expensive, and distract the attention of management, and there can be no assurance that we would prevail.
We have been subject to litigation claiming that we have infringed the rights of others and/or that certain of our patents and other intellectual property are invalid or unenforceable. We have also brought actions against others to protect our rights.
GOVERNMENT REGULATION
We are subject to regulation by governmental authorities in most jurisdictions in which we offer our products. The development and distribution of casino games, gaming equipment, systems technology and related services, as well as the operation of casinos, are all subject to regulation by a variety of federal, state, international, tribal, and local agencies with the majority of oversight provided by individual state gaming control boards. While the regulatory requirements vary by jurisdiction, most require:
Gaming regulatory requirements vary from jurisdiction to jurisdiction, and obtaining licenses, registrations, findings of suitability for our officers, directors, and principal stockholders and other required approvals with respect to us, our personnel and our products are time consuming and expensive. Generally, gaming regulatory authorities have broad discretionary powers and may deny applications for or revoke approvals on any basis they deem reasonable. We have approvals that enable us to conduct our business in numerous jurisdictions, subject in each case to the conditions of the particular approvals. These conditions may include limitations as to the type of game or product we may sell or lease, as well as limitations on the type of facility, such as riverboats, and the territory within which we may operate, such as tribal nations. Gaming laws and regulations serve to protect the public interest and ensure gambling related activity is conducted honestly, competitively and free of corruption. Regulatory oversight additionally ensures that the local authorities receive the appropriate amount of gaming tax revenues. As such, our financial systems and reporting functions must demonstrate high levels of detail and integrity.
We also have authorizations with certain Native American tribes throughout the United States that have compacts with the states in which their tribal dominions are located or operate or propose to operate casinos. These tribes generally require suppliers of gaming and gaming-related equipment to obtain authorizations. Gaming on Native American lands within the United States is governed by the Federal Indian Gaming Regulatory Act of 1988 (“IGRA”) and specific tribal ordinances and regulations. Class III gaming (table games
7
and slot machines, for example), as defined under IGRA, also requires a Tribal-State Compact, which is a written agreement between a specific tribe and the respective state. This compact authorizes the type of Class III gaming activity and the standards, procedures and controls under which the Class III gaming activity must be conducted. The National Indian Gaming Commission (“NIGC”) has oversight authority over gaming on Native American lands and generally monitors tribal gaming, including the establishment and enforcement of required minimum internal control standards. Each tribe is sovereign and must have a tribal gaming commission or office established to regulate tribal gaming activity to ensure compliance with IGRA, NIGC, and its Tribal-State Compact. We have complied with each of the numerous vendor licensing, specific product approvals and shipping notification requirements imposed by Tribal-State Compacts and enforced by tribal and/or state gaming agencies under IGRA in the Native American lands in which we do business.
The nature of the industry and our worldwide operations make the license application process very time consuming and require extensive resources. We engage legal resources familiar with local customs in certain jurisdictions to assist in keeping us compliant with applicable regulations worldwide. Through this process, we seek to assure both regulators and investors that all our operations maintain the highest levels of integrity and avoid any appearance of impropriety.
We have obtained or applied for all required government licenses, permits, registrations, findings of suitability and approvals necessary to develop and distribute gaming products in all jurisdictions where we directly operate. Although many regulations at each level are similar or overlapping, we must satisfy all conditions individually for each jurisdiction. Additionally, in certain jurisdictions we license our products through distributors authorized to do business in those jurisdictions.
In addition to what may be required of our officers, board members, key employees and substantial interest holders, any of our stakeholders, including but not limited to investors, may be subject to regulatory requests and suitability findings. Failure to comply with regulatory requirements or obtaining a finding of unsuitability by a regulatory body could result in a substantial or total loss of investment.
In the future, we intend to seek the necessary registrations, licenses, approvals, and findings of suitability for us, our products, and our personnel in other jurisdictions throughout the world. However, we may be unable to obtain such necessary items, or if such items are obtained, may be revoked, suspended, or conditioned. In addition, we may be unable to obtain on a timely basis, or to obtain at all, the necessary approvals of our future products as they are developed, even in those jurisdictions in which we already have existing products licensed or approved. If the necessary registrations are not sought after or the required approvals not received, we may be prohibited from selling our products in that jurisdiction or may be required to sell our products through other licensed entities at a reduced profit.
EMPLOYEES
As of December 31, 2024, we had 47 full-time employees, including executive officers, management personnel, accounting personnel, office staff, sales staff, service technicians and research and development personnel. As needed, we also employ part-time and temporary employees and pay for the services of independent contractors.
Available Information
Our annual report on Form 10-K, quarterly reports on Form 10-Q, current reports on Form 8-K, and amendments to those reports are accessible on our website at https://ir.galaxygaming.com by clicking on the tab labeled “SEC Filings.” These reports are made available, without charge, as soon as is reasonably practicable after we file or furnish them electronically with the Securities and Exchange Commission. The information contained on, or that can be accessed through, our website is not a part of, or incorporated by reference into, this Annual Report on form 10-K.
ITEM 1A. RISK FACTORS
The announcement and pendency of our agreement to be acquired by Parent may have an adverse effect on our business, operating results and our stock price, and may result in the loss of employees, customers, suppliers, and other business partners.
On July 18, 2024, we entered into the Merger Agreement. We are subject to risks in connection with the announcement and pendency of the Merger regardless of whether the Merger is completed, including, but not limited to, the following:
8
The adverse effects of the pendency of the Merger could be exacerbated by any delays in completion of the Merger or termination of the Merger Agreement.
While the Merger is pending, we are subject to contractual restrictions that could harm our business, operating results and our stock price.
The Merger Agreement includes restrictions on the conduct of our business prior to the completion of the Merger, generally requiring us to conduct our businesses in all material respects in the ordinary course of business, to use reasonable best efforts to cooperate in seeking regulatory approvals, and to not engage in certain specified activities without Parent’s prior consent. We may find that these and other obligations in the Merger Agreement may delay or prevent us from or limit our ability to respond effectively to competitive pressures, industry developments and future business opportunities that may arise during such period, even if our management and board of directors think they may be advisable. These restrictions could adversely impact our business, operating results and our stock price and our perceived acquisition value, regardless of whether the Merger is completed.
The failure to complete the Merger within the expected timeframe or at all may adversely affect our business and our stock price.
The consummation of the Merger is subject to a number of closing conditions, including, among other things, the receipt of certain gaming regulatory approvals. There can be no assurance that these conditions to the completion of the Merger will be satisfied, or that the Merger will be completed on the proposed terms, within the expected timeframe or at all. If the Merger is not completed, we may be subject to negative publicity or be negatively perceived by the investment or business communities and our stock price could fall to the extent that our current stock price reflects an assumption that the Merger will be completed. Furthermore, if the Merger is not completed, regardless of the reason, we may suffer other consequences that could adversely affect our business and results of our operations.
The Merger Agreement with Parent limits our ability to pursue alternative transactions which could deter a third party from proposing an alternative transaction.
The Merger Agreement contains provisions that, subject to certain exceptions, limit our ability to initiate, solicit, or knowingly facilitate (including by way of furnishing non-public information) the submission of any inquiries, regarding, or the making of any inquiry, proposal or offer that constitutes, or would reasonably be expected to lead to, a Takeover Proposal (as defined in the Merger Agreement), or take certain other restricted actions in connection therewith. It is possible that these or other provisions in the Merger Agreement might discourage a potential competing acquirer that might have an interest in acquiring all or a significant part of our
9
outstanding common stock from considering or proposing an acquisition or might result in a potential competing acquirer proposing to pay a lower per share price to acquire our common stock than it might otherwise have proposed to pay.
We and our directors may be subject to litigation challenging the Merger, and an unfavorable judgment or ruling in any such lawsuits could prevent or delay the consummation of the Merger and/or result in substantial costs.
Beginning on September 11, 2024, seven purported stockholders of Galaxy have sent demands to the Company, two of which included draft complaints. On October 18, 2024, two purported stockholders filed complaints relating to the Merger Agreement disclosures, captioned Finger v. Galaxy Gaming, Inc., et al., Index No. 655536/2024 (N.Y. Sup. Ct.) and Coffman v. Galaxy Gaming, Inc., et al., Index No. 655530/2024 (N.Y. Sup. Ct.). The demand letters and complaints allege that the definitive proxy statement on Schedule 14A filed by the Company on September 26, 2024, is materially incomplete and misleading because it omitted certain information related to the Merger (as defined herein), including but not limited to information about the Company’s financial projections and analyses performed by Galaxy’s financial advisor, Macquarie Capital (USA) Inc.
Additional lawsuits and demand letters arising out of the Merger may also be filed or received in the future. The outcome of any such demands and complaints and any litigation ensuing from such demands and complaints cannot be assured, including the amount of fees and costs associated with defending these claims or any other liabilities that may be incurred in connection therewith. Whether or not any plaintiff’s claim is successful, this type of litigation can result in significant costs and divert our attention and resources from the Merger and ongoing business activities, which could adversely affect our operations. In addition, if dismissals are not obtained or a settlement is not reached, these lawsuits could prevent or delay completion of the Merger.
ITEM 1B. UNRESOLVED STAFF COMMENTS
A smaller reporting company is not required to provide the information required by this Item.
ITEM 1C. CYBERSECURITY
Risk Management and Strategy
We have developed and implemented cybersecurity risk management processes intended to protect the confidentiality,
Our cybersecurity risk management program includes:
We have not identified risks from known cybersecurity threats, that have materially affected or are reasonably likely to
Governance
Our Board considers cybersecurity risk as part of its risk oversight function.
Our management team supervises efforts to prevent, detect, mitigate, and remediate cybersecurity risks and incidents through various means, which may include briefings from external security personnel; threat intelligence and other information obtained from
10
governmental, public or private sources; and alerts and reports produced by security tools deployed in the information technology environment.
ITEM 2. PROPERTIES
We do not own any real property used in the operation of our current business. We maintain our corporate office at 6480 Cameron Street, Suite 305, Las Vegas, Nevada, where we currently occupy approximately 14,000 square feet of combined office and warehouse space. We also maintain a small warehouse and service facility in Kent, Washington and a small office in Richland, Washington. See Note 8 to our audited financial statements included in Item 8 “Financial Statements and Supplementary Financial Information” for further details.
ITEM 3. LEGAL PROCEEDINGS
We have been named in and have brought lawsuits in the normal course of business. See Note 10 to our audited financial statements included in Item 8 “Financial Statements and Supplementary Financial Information” for further details.
ITEM 4. MINE SAFETY DISCLOSURES
A smaller reporting company is not required to provide the information required by this Item.
11
PART II
ITEM 5. MARKET FOR REGISTRANT’S COMMON EQUITY AND RELATED STOCKHOLDER MATTERS
Our common stock is quoted on the OTCQB marketplace (“OTCQB”) under the ticker symbol GLXZ.
The following table sets forth the range of high and low closing sale prices for our common stock for each of the periods indicated as reported by the OTCQB.
|
|
|
|
2024 |
|
|
|
2023 |
|
||||||||||
Quarter Ended |
|
|
High ($) |
|
|
|
Low ($) |
|
|
|
High ($) |
|
Low ($) |
|
|||||
March 31, |
|
|
|
|
1.90 |
|
|
|
|
1.33 |
|
|
|
|
3.15 |
|
|
2.30 |
|
June 30, |
|
|
|
|
1.60 |
|
|
|
|
1.26 |
|
|
|
|
2.70 |
|
|
2.34 |
|
September 30, |
|
|
|
|
2.84 |
|
|
|
|
1.38 |
|
|
|
|
3.05 |
|
|
2.50 |
|
December 31, |
|
|
|
|
2.84 |
|
|
|
|
2.69 |
|
|
|
|
2.90 |
|
|
1.40 |
|
The Securities and Exchange Commission (the “SEC”) has adopted rules that regulate broker-dealer practices in connection with transactions in penny stocks. Penny stocks are generally equity securities with a market price of less than $5.00, other than securities registered on certain national securities exchanges or quoted on the NASDAQ system, provided that current price and volume information with respect to transactions in such securities is provided by the exchange or system. The penny stock rules require a broker-dealer, prior to a transaction in a penny stock, to deliver a standardized risk disclosure document prepared by the SEC, that: (a) contains a description of the nature and level of risk in the market for penny stocks in both public offerings and secondary trading; (b) contains a description of the broker’s or dealer’s duties to the customer and of the rights and remedies available to the customer with respect to a violation of such duties or other requirements of the securities laws; (c) contains a brief, clear, narrative description of a dealer market, including bid and ask prices for penny stocks and the significance of the spread between the bid and ask price; (d) contains a toll-free telephone number for inquiries on disciplinary actions; (e) defines significant terms in the disclosure document or in the conduct of trading in penny stocks; and (f) contains such other information and is in such form, including language, type size and format, as the SEC shall require by rule or regulation.
The broker-dealer also must provide, prior to effecting any transaction in a penny stock, the customer with (a) bid and offer quotations for the penny stock; (b) the compensation of the broker-dealer and its salesperson in the transaction; (c) the number of shares to which such bid and ask prices apply, or other comparable information relating to the depth and liquidity of the market for such stock; and (d) a monthly account statement showing the market value of each penny stock held in the customer’s account.
In addition, the penny stock rules require that prior to a transaction in a penny stock not otherwise exempt from those rules, the broker-dealer must make a special written determination that the penny stock is a suitable investment for the purchaser and receive the purchaser’s written acknowledgment of the receipt of a risk disclosure statement, a written agreement as to transactions involving penny stocks, and a signed and dated copy of a written suitability statement.
These disclosure requirements may have the effect of reducing the trading activity for our common stock. Therefore, stockholders may have difficulty buying or selling our securities.
HOLDERS OF OUR COMMON STOCK
As of March 4, 2025, we had 25,115,299 shares of our common stock issued and outstanding and 38 stockholders of record. The number of holders of record does not include stockholders for whom shares were held in “nominee” or “street name.”
DIVIDEND POLICY
There are no restrictions in our articles of incorporation or bylaws that prevent us from declaring dividends. The Nevada Revised Statutes, however, do prohibit us from declaring dividends where after giving effect to the distribution of the dividend:
We have not declared any dividends, and we do not plan to declare any dividends in the foreseeable future. Our credit facility impose significant restrictions on our ability to pay dividends.
12
TRANSFER AGENT
Our stock transfer agent and registrar is Pacific Stock Transfer Company located at 6725 Via Austi Parkway, Suite 300, Las Vegas, Nevada, 89119. Their telephone number is (540) 216-0187.
13
ITEM 7. MANAGEMENT’S DISCUSSION AND ANALYSIS OF FINANCIAL CONDITION AND RESULTS OF OPERATIONS
The following is a discussion and analysis of our financial condition, results of operations and liquidity and capital resources as of and for the years ended December 31, 2024 and 2023. This discussion should be read together with our audited consolidated financial statements and related notes included in Item 8. Financial Statements and Supplementary Financial Information. Some of the information contained in this discussion includes forward-looking statements that involve risks and uncertainties; therefore our “Special Note Regarding Forward-Looking Statements” should be reviewed for a discussion of important factors that could cause actual results to differ materially from the results described in, or implied by, such forward-looking statements.
OVERVIEW
We develop, acquire, assemble and market technology and entertainment-based products and services for the gaming industry for placement on casino floors and on legal internet gaming sites. Our products and services primarily relate to licensed casino operators’ table games activities and focus on either increasing their profitability and productivity or expanding their gaming entertainment offerings in the form of proprietary table games, electronically enhanced table game platforms, fully-automated electronic tables and other ancillary equipment. In addition, we license intellectual property to legal internet gaming operators. Our products and services are offered in various highly regulated markets and certain non-regulated (where such is not illegal) markets throughout the world. Our products are assembled at our headquarters in Las Vegas, Nevada, as well as outsourced for certain sub-assemblies in the United States.
Agreement and Plan of Merger with Evolution
On July 18, 2024, we entered into the Merger Agreement providing for the Company’s acquisition by Evolution Malta Holding Limited in a cash transaction. The Merger is subject to the satisfaction or waiver of certain closing conditions, including approval by at least a majority of the voting power of the outstanding shares of the Company’s common stock of the Merger Agreement and the transactions contemplated thereby, including the Merger, and the receipt of certain gaming regulatory approvals. At the special meeting of the Company’s stockholders held on November 12, 2024, stockholders voted to approve the Merger. The Merger is expected to be completed in mid-2025, subject to satisfaction or waiver of the closing conditions. Upon completion of the Merger, the Company will become a privately held company and shares of Company’s common stock will no longer be listed on any public market.
14
Results of operations for the years ended December 31, 2024 and 2023.
Our net revenue consists of the following components:
|
Twelve Months Ended December 31, |
|
|
|
|
|
|
|
|||||||
|
2024 |
|
|
2023 |
|
|
$ Change |
|
|
% Change |
|
||||
Revenue: |
|
|
|
|
|
|
|
|
|
|
|
||||
Core Revenues: |
|
|
|
|
|
|
|
|
|
|
|
||||
Recurring License Revenue |
$ |
21,028,970 |
|
|
$ |
16,727,597 |
|
|
$ |
4,301,373 |
|
|
|
25.7 |
% |
Perpetual License Sales of Progressive Gaming Systems |
|
3,502,053 |
|
|
|
3,625,357 |
|
|
|
(123,304 |
) |
|
|
-3.4 |
% |
Gross Revenue |
|
24,531,023 |
|
|
|
20,352,954 |
|
|
|
4,178,069 |
|
|
|
20.5 |
% |
Royalties Netted against Gross Revenue |
|
(3,143,931 |
) |
|
|
(996,665 |
) |
|
|
(2,147,266 |
) |
|
|
215.4 |
% |
Total Core Revenue |
$ |
21,387,092 |
|
|
$ |
19,356,289 |
|
|
$ |
2,030,803 |
|
|
|
10.5 |
% |
|
|
|
|
|
|
|
|
|
|
|
|
||||
Digital Revenues: |
|
|
|
|
|
|
|
|
|
|
|
||||
Recurring License Revenue |
$ |
14,283,982 |
|
|
$ |
11,378,918 |
|
|
$ |
2,905,064 |
|
|
|
25.5 |
% |
Gross Revenue |
|
14,283,982 |
|
|
|
11,378,918 |
|
|
|
2,905,064 |
|
|
|
25.5 |
% |
Royalties Netted against Gross Revenue |
|
(3,933,608 |
) |
|
|
(2,946,123 |
) |
|
|
(987,485 |
) |
|
|
33.5 |
% |
Total Digital Revenue |
$ |
10,350,374 |
|
|
$ |
8,432,795 |
|
|
$ |
1,917,579 |
|
|
|
22.7 |
% |
|
|
|
|
|
|
|
|
|
|
|
|
||||
Consolidated Revenues: |
|
|
|
|
|
|
|
|
|
|
|
||||
Recurring License Revenue |
$ |
35,312,952 |
|
|
$ |
28,106,515 |
|
|
$ |
7,206,437 |
|
|
|
25.6 |
% |
Perpetual License Sales of Progressive Gaming Systems |
|
3,502,053 |
|
|
|
3,625,357 |
|
|
|
(123,304 |
) |
|
|
-3.4 |
% |
Gross Revenue |
|
38,815,005 |
|
|
|
31,731,872 |
|
|
|
7,083,133 |
|
|
|
22.3 |
% |
Royalties Netted against Gross Revenue |
|
(7,077,539 |
) |
|
|
(3,942,788 |
) |
|
|
(3,134,751 |
) |
|
|
79.5 |
% |
Revenue |
$ |
31,737,466 |
|
|
$ |
27,789,084 |
|
|
$ |
3,948,382 |
|
|
|
14.2 |
% |
|
|
|
|
|
|
|
|
|
|
|
|
||||
Costs and expenses |
|
|
|
|
|
|
|
|
|
|
|
||||
Cost of ancillary products and assembled components |
$ |
1,509,776 |
|
|
$ |
1,263,271 |
|
|
$ |
246,505 |
|
|
|
19.5 |
% |
Selling, general and administrative |
|
19,685,457 |
|
|
|
15,676,628 |
|
|
|
4,008,829 |
|
|
|
25.6 |
% |
Research and development |
|
1,057,183 |
|
|
|
823,189 |
|
|
|
233,994 |
|
|
|
28.4 |
% |
Depreciation and amortization |
|
2,863,507 |
|
|
|
2,274,461 |
|
|
|
589,046 |
|
|
|
25.9 |
% |
Stock-based compensation |
|
919,649 |
|
|
|
1,021,953 |
|
|
|
(102,304 |
) |
|
|
-10.0 |
% |
Total costs and expenses |
|
26,035,572 |
|
|
|
21,059,502 |
|
|
|
4,976,070 |
|
|
|
23.6 |
% |
Income from operations |
|
5,701,894 |
|
|
|
6,729,582 |
|
|
|
(1,027,688 |
) |
|
|
-15.3 |
% |
Other income (expense): |
|
|
|
|
|
|
|
|
|
|
|
||||
Interest income |
|
780,933 |
|
|
|
611,271 |
|
|
|
169,662 |
|
|
|
27.8 |
% |
Interest expense |
|
(9,066,203 |
) |
|
|
(9,063,112 |
) |
|
|
(3,091 |
) |
|
|
0.0 |
% |
Foreign currency exchange gain (loss) |
|
13,913 |
|
|
|
(6,099 |
) |
|
|
20,012 |
|
|
|
-328.1 |
% |
Total other income (expense), net |
|
(8,271,357 |
) |
|
|
(8,457,940 |
) |
|
|
186,583 |
|
|
|
-2.2 |
% |
Loss before provision for income taxes |
$ |
(2,569,463 |
) |
|
$ |
(1,728,358 |
) |
|
$ |
(841,105 |
) |
|
|
48.7 |
% |
Provision for income taxes |
|
(57,647 |
) |
|
|
(79,228 |
) |
|
|
21,581 |
|
|
|
-27.2 |
% |
Net loss |
$ |
(2,627,110 |
) |
|
$ |
(1,807,586 |
) |
|
$ |
(819,524 |
) |
|
|
45.3 |
% |
Revenue
Recurring core revenue increased $4,301,373, or 25.7% for the twelve months ended December 31, 2024, as compared to the same period in the prior year. This growth was primarily driven by favorable revenue from our EZ Baccarat distribution arrangement, which began in September 2023, along with the continued success of our side bets and progressive products. Royalties netted against gross core revenue increased $2,147,266 for the twelve months ended December 31, 2024, as compared to the same period in the prior year. This increase was attributable to royalties paid on our EZ Baccarat revenues. Perpetual license sales of our progressive gaming systems was $3,502,053, representing a 3.4% percent decrease for the twelve months ended December 31, 2024, as compared to the same period in the prior year. Gross digital revenues of $14,283,982, increased $2,905,064, or 25.5% for the twelve months ended December 31, 2024, as compared to the same period in the prior year. This favorable growth reflects the ongoing expansion of digital content into new markets and the continued success of our competitive branded products, particularly the well-known 21+3. Net of royalties, digital
15
revenues increased to $1,917,579, representing growth of 22.7% for the twelve months ended December 31, 2024, as compared to the same period in the prior year.
Cost and Expenses
Cost of ancillary products and assembled component expense increased $246,505, or 19.5% for the twelve months ended December 31, 2024, as compared to the same period in the prior year. This increase is primarily driven by product mix, with a larger proportion of lower-margin items sold. Additionally, there was a secondary impact from higher component costs related to the perpetual license sales of our progressive gaming systems.
Selling, general and administrative expenses increased $4,008,829, or 25.6% for the twelve months ended December 31, 2024, as compared to the same period in the prior year. This change was due to expenses associated with special projects of $3,489,955, notably legal expenses incurred related to the acquisition by Evolution and to a lesser extent driven by higher internal labor and related expenses (base salary, commissions, payroll-related taxes, bonus accrual and travel), increased repair and maintenance costs of leased machines, and increased information technology costs. Without the costs associated with the acquisition by Evolution and excluding the related transaction fees of $3,489,955, selling, general, and administrative expenses increased $518,874, or 3% for the twelve months ended December 31, 2024, as compared to the same period in the prior year.
Research and development expenses for the twelve months ended December 31, 2024, were $1,057,183 compared to $823,189 for the comparable prior-year period, representing an increase of $233,994, or 28.4%. This increase was driven by higher payroll costs due to increased headcount, employee bonuses, and the ongoing development of internal software placed in service.
Depreciation and amortization increased $589,046, or 25.9% for the twelve months ended December 31, 2024, as compared to the same period in the prior year. This increase was primarily driven by depreciation expense associated with incremental placements of assets deployed at client locations.
Stock-based compensation expenses decreased 10.0% for the twelve months ended December 31, 2024, as compared to the same period in the prior year. The decrease was primarily due to changes in the level and composition of stock-based compensation paid to members of our Board of Directors in 2024, which included a reduction in the number of board members for part of the year. Additionally, lower stock-based compensation for employees and consultants contributed to the decline.
Interest expense remained relatively flat at $9,066,203 for the twelve months ended December 31, 2024, as compared to interest expense of $9,063,112 for the comparable prior-year period. Interest income increased 27.8% compared to the prior year period, benefitting from higher cash balances and interest rate fluctuations.
Income tax provision was $57,647 for the twelve months ended December 31, 2024, compared to income tax provision of $79,228 for the comparable prior-year period. The decrease in expense is primarily driven by the increase in loss before provision for income taxes.
Primarily as a result of the factors described above, we had a net loss of $2,627,110 for the twelve months ended December 31, 2024, as compared to a net loss of approximately $1,807,586 for the same period in the prior year.
16
Adjusted Earnings Before Interest, Taxes, Depreciation and Amortization (“EBITDA”). Adjusted EBITDA includes adjustments to net loss to exclude interest, income taxes, depreciation, amortization, stock-based compensation, foreign currency exchange (gain), and severance and other expenses related to litigation. Adjusted EBITDA is not a measure of performance defined in accordance with U.S. Generally Accepted Accounting Principles (“U.S. GAAP”). However, Adjusted EBITDA is used by management to evaluate our operating performance. Management believes that disclosure of the Adjusted EBITDA metric offers investors, regulators and other stakeholders a view of our operations in the same manner management evaluates our performance. When combined with U.S. GAAP results, management believes Adjusted EBITDA provides a comprehensive understanding of our financial results. Adjusted EBITDA should not be considered as an alternative to net income or (loss) to net cash provided by operating activities as a measure of operating results or of liquidity. It may not be comparable to similarly titled measures used by other companies, and it excludes financial information that some may consider important in evaluating our performance. A reconciliation of "U.S. GAAP" net income to Adjusted EBITDA is as follows:
|
|
Year Ended December 31, |
|
|||||
Adjusted EBITDA Reconciliation: |
|
2024 |
|
|
2023 |
|
||
Net loss |
|
$ |
(2,627,110 |
) |
|
$ |
(1,807,586 |
) |
Interest expense |
|
|
9,066,203 |
|
|
|
9,063,112 |
|
Interest income |
|
|
(780,933 |
) |
|
|
(611,271 |
) |
Provision for income taxes |
|
|
57,647 |
|
|
|
79,228 |
|
Depreciation and amortization |
|
|
2,863,507 |
|
|
|
2,274,461 |
|
EBITDA |
|
|
8,579,314 |
|
|
|
8,997,944 |
|
Stock-based compensation (1) |
|
|
919,649 |
|
|
|
1,021,953 |
|
Employee severance costs and other expenses (2) |
|
|
24,482 |
|
|
|
474,798 |
|
CEO transition expenses (3) |
|
|
8,200 |
|
|
|
128,106 |
|
Professional fees, acquisition costs and other (4) |
|
|
3,489,955 |
|
|
|
5,969 |
|
Loss on disposal of assets (5) |
|
|
33,245 |
|
|
|
— |
|
Foreign exchange (gain) loss (6) |
|
|
(13,913 |
) |
|
|
6,099 |
|
Adjusted EBITDA |
|
$ |
13,040,932 |
|
|
$ |
10,634,869 |
|
(1) Represents the non-cash expense associated with the value of equity awards granted to employees, directors and consultants by the Company.
(2) Represents costs associated with the severance of employees.
(3) Represents Company reimbursed moving expenses incurred by the new President and CEO, Matthew Reback.
(4) Represents professional fees and transaction related fees incurred related to acquisitions, mergers and professional fees incurred for other projects not considered part of the normal course of business.
(5) Represents non-cash charge related to the write off of certain fixed assets.
(6) Represents foreign exchange losses and gains associated with the fluctuations of foreign currency rates.
Liquidity and capital resources. We have generally been able to fund our continuing operations, our investments, and the obligations under our existing borrowings through cash flow from operations. We may require additional capital to undertake acquisitions or to repay in full our indebtedness. Our ability to access capital for operations or for acquisitions will depend on conditions in the capital markets and investors’ perceptions of our business prospects and such conditions and perceptions may not always favor us.
As of December 31, 2024, we had total current assets of $24,171,920 and total assets of $41,010,731. As of December 31, 2023, we had total current assets of $22,156,035 and total assets of $40,475,800. The increase in current assets as of December 31, 2024, compared to December 31, 2023, was due to the increased cash and cash equivalents driven by cash provided by operating activities and increased accounts receivable. The increase in total assets as of December 31, 2024, compared to December 31, 2023, was primarily due to the increase of current assets noted above and offset by a decrease in other intangible assets and operating lease right-of-use assets as a result of amortization in 2024.
Our total current liabilities as of December 31, 2024, increased to $6,602,744 from $4,875,967 as of December 31, 2023, primarily due to an increase in accounts payable related to professional fees in connection with the acquisition by Evolution.
Based on our current forecast of operations, we believe we will have sufficient liquidity to fund our operations and to meet the obligations under our financing arrangements as they come due over at least the next 12 months.
We continue to file applications for new or enhanced licenses in several jurisdictions, which may result in significant future legal and regulatory expenses. A significant increase in such expenses may require us to postpone growth initiatives or investments in personnel, inventory and research and development of our products. It is our intention to continue such initiatives and investments.
17
Our operating activities provided cash of $4,098,634 for the year ended December 31, 2024, compared to cash provided of $2,729,477 for the year ended December 31, 2023. This change is attributable to a favorable variance of $1,726,976 in use of assets and liabilities that relate to operations. Additionally, depreciation and amortization increased $589,046 related to increased capitalization of intangible assets and offset by a $102,304 decline in stock-based compensation from the vesting of stock options and a $70,862 decrease in reserve for credit losses.
Investing activities used cash of $1,622,604 for the year ended December 31, 2024, and $2,955,681 for the year ended December 31, 2023. This decrease in cash used was primarily due to the increase in the transfer of title of assets deployed at client locations to perpetual license customers in conjunction with a decrease in cash used for the acquisition of assets deployed.
Cash used in financing activities for the year ended December 31, 2024, was $886,126. This compares to $1,367,304 cash used by financing activities for the twelve months ended December 31, 2023. The decrease in cash used was primarily due to the absence of principal payments on our borrowings based on the "Excess Cash Flow" calculation as defined by the terms in the Fortress Credit Agreement (Note 9), in the 2024 period.
Credit Facility. In November 2021, we entered into a $60,000,000 senior secured term loan agreement. Subsequent to December 31, 2024, we entered into a new credit agreement that provides for a $2,000,000 senior secured revolving credit facility and a $45,000,000 senior secured term loan. On January 6, 2025, we borrowed $45,000,000 under the new term loan and used this amount plus cash on hand to repay all amounts outstanding under the previous term loan agreement, which was terminated.
Critical Accounting Policies. Our consolidated financial statements have been prepared in accordance with U.S. GAAP. We consider the following accounting policies to be the most important to understanding and evaluating our financial results.
Revenue recognition. We account for our revenue in accordance with Accounting Standards Codification Topic 606, Revenue from Contracts with Customers. We generate revenue primarily from the licensing of our intellectual property. We recognize revenue under recurring fee license contracts monthly as we satisfy our performance obligation, which consists of granting the customer the right to use our intellectual property. Amounts billed are determined based on flat rates or usage rates stipulated in the customer contract.
We sell the perpetual right to use our intellectual property, and from time to time, sell the units used to deliver the gaming systems. Control transfers and we recognize revenue at a point in time when the gaming system is available for use by a customer, which is no earlier than the shipment of the products to the customer or an intermediary for the customer.
Off-balance sheet arrangements. As of December 31, 2024, there were no off-balance sheet arrangements.
Recently issued accounting pronouncements. We do not expect the adoption of recently issued accounting pronouncements to have a significant impact on our results of operations, financial position or cash flow.
ITEM 7A. QUANTITATIVE AND QUALITATIVE DISCLOSURES ABOUT MARKET RISK
A smaller reporting company is not required to provide the information required by this Item.
18
ITEM 8. FINANCIAL STATEMENTS AND SUPPLEMENTARY FINANCIAL INFORMATION
INDEX TO FINANCIAL STATEMENTS
Report of Independent Registered Public Accounting Firm, (Moss Adams LLP, San Diego, CA, PCAOB ID: |
|
20 |
Consolidated Balance Sheets as of December 31, 2024 and 2023 |
|
21 |
|
22 |
|
|
23 |
|
Consolidated Statements of Cash Flows for the years ended December 31, 2024 and 2023 |
|
24 |
|
25 |
19
REPORT OF INDEPENDENT REGISTERED PUBLIC ACCOUNTING FIRM
To the Shareholders and the Board of Directors of
Galaxy Gaming, Inc.
Opinion on the Financial Statements
We have audited the accompanying consolidated balance sheets of Galaxy Gaming, Inc. (the “Company”) as of December 31, 2024 and 2023, the related consolidated statements of operations and comprehensive loss, stockholders’ deficit and cash flows for the years then ended, and the related notes (collectively referred to as the “consolidated financial statements”). In our opinion, the consolidated financial statements present fairly, in all material respects, the consolidated financial position of the Company as of December 31, 2024 and 2023, and the consolidated results of its operations and its cash flows for the years then ended, in conformity with accounting principles generally accepted in the United States of America.
Basis for Opinion
These consolidated financial statements are the responsibility of the Company’s management. Our responsibility is to express an opinion on the Company’s consolidated financial statements based on our audits. We are a public accounting firm registered with the Public Company Accounting Oversight Board (United States) (“PCAOB”) and are required to be independent with respect to the Company in accordance with the U.S. federal securities laws and the applicable rules and regulations of the Securities and Exchange Commission and the PCAOB.
We conducted our audits in accordance with the standards of the PCAOB. Those standards require that we plan and perform the audit to obtain reasonable assurance about whether the consolidated financial statements are free of material misstatement, whether due to error or fraud. The Company is not required to have, nor were we engaged to perform, an audit of its internal control over financial reporting. As part of our audits we are required to obtain an understanding of internal control over financial reporting but not for the purpose of expressing an opinion on the effectiveness of the Company’s internal control over financial reporting. Accordingly, we express no such opinion.
Our audits included performing procedures to assess the risks of material misstatement of the consolidated financial statements, whether due to error or fraud, and performing procedures to respond to those risks. Such procedures included examining, on a test basis, evidence regarding the amounts and disclosures in the consolidated financial statements. Our audits also included evaluating the accounting principles used and significant estimates made by management, as well as evaluating the overall presentation of the consolidated financial statements. We believe that our audits provide a reasonable basis for our opinion.
Critical Audit Matters
Critical audit matters are matters arising from the current period audit of the consolidated financial statements that were communicated or required to be communicated to the audit committee and that (1) relate to accounts or disclosures that are material to the financial statements and (2) involved our especially challenging, subjective, or complex judgments. We determined that there are no critical audit matters.
/s/
March 21, 2025
We have served as the Company’s auditor since 2020.
20
GALAXY GAMING, INC.
CONSOLIDATED BALANCE SHEETS
DECEMBER 31, 2024 AND 2023
ASSETS |
|
December 31, |
|
|
December 31, |
|
||
Current assets: |
|
|
|
|
|
|
||
Cash and cash equivalents |
|
$ |
|
|
$ |
|
||
Accounts receivable, net of allowance of $ |
|
|
|
|
|
|
||
Income tax receivable |
|
|
|
|
|
|
||
Prepaid expenses |
|
|
|
|
|
|
||
Total current assets |
|
|
|
|
|
|
||
Property and equipment, net |
|
|
|
|
|
|
||
Operating lease right-of-use assets |
|
|
|
|
|
|
||
Assets deployed at client locations, net |
|
|
|
|
|
|
||
Goodwill |
|
|
|
|
|
|
||
Other intangible assets, net |
|
|
|
|
|
|
||
Other assets |
|
|
|
|
|
|
||
Total assets |
|
$ |
|
|
$ |
|
||
LIABILITIES AND STOCKHOLDERS’ DEFICIT |
|
|
|
|
|
|
||
Current liabilities: |
|
|
|
|
|
|
||
Accounts payable |
|
$ |
|
|
$ |
|
||
Accrued expenses |
|
|
|
|
|
|
||
Revenue contract liability |
|
|
— |
|
|
|
|
|
Current portion of operating lease liabilities |
|
|
|
|
|
|
||
Current portion of long-term debt |
|
|
|
|
|
|
||
Total current liabilities |
|
|
|
|
|
|
||
Long-term operating lease liabilities |
|
|
|
|
|
|
||
Long-term debt and liabilities, net |
|
|
|
|
|
|
||
Deferred tax liabilities, net |
|
|
|
|
|
|
||
Total liabilities |
|
|
|
|
|
|
||
|
|
|
|
|
|
|||
Stockholders’ deficit |
|
|
|
|
|
|
||
Preferred stock, |
|
|
|
|
|
|
||
Common stock, |
|
|
|
|
|
|
||
Additional paid-in capital |
|
|
|
|
|
|
||
Accumulated deficit |
|
|
( |
) |
|
|
( |
) |
Accumulated other comprehensive loss |
|
|
( |
) |
|
|
( |
) |
Total stockholders’ deficit |
|
|
( |
) |
|
|
( |
) |
Total liabilities and stockholders’ deficit |
|
$ |
|
|
$ |
|
||
The accompanying notes are an integral part of the consolidated financial statements.
21
GALAXY GAMING, INC.
CONSOLIDATED STATEMENTS OF OPERATIONS AND COMPREHENSIVE LOSS
YEARS ENDED DECEMBER 31, 2024 AND 2023
|
|
Year Ended |
|
|||||
|
|
December 31, 2024 |
|
|
December 31, 2023 |
|
||
Revenue: |
|
|
|
|
|
|
||
Licensing fees |
|
$ |
|
|
$ |
|
||
Total revenue |
|
|
|
|
|
|
||
Costs and expenses: |
|
|
|
|
|
|
||
Cost of ancillary products and assembled components |
|
|
|
|
|
|
||
Selling, general and administrative |
|
|
|
|
|
|
||
Research and development |
|
|
|
|
|
|
||
Depreciation and amortization |
|
|
|
|
|
|
||
Stock-based compensation |
|
|
|
|
|
|
||
Total costs and expenses |
|
|
|
|
|
|
||
Income from operations |
|
|
|
|
|
|
||
Other income (expense): |
|
|
|
|
|
|
||
Interest income |
|
|
|
|
|
|
||
Interest expense |
|
|
( |
) |
|
|
( |
) |
Foreign currency exchange gain (loss) |
|
|
|
|
|
( |
) |
|
Total other expense, net |
|
|
( |
) |
|
|
( |
) |
Loss before provision for income taxes |
|
|
( |
) |
|
|
( |
) |
Provision for income taxes |
|
|
( |
) |
|
|
( |
) |
Net loss |
|
|
( |
) |
|
|
( |
) |
Foreign currency translation adjustment |
|
|
( |
) |
|
|
|
|
Comprehensive loss |
|
$ |
( |
) |
|
$ |
( |
) |
|
|
|
|
|
|
|
||
Net loss per share: |
|
|
|
|
|
|
||
Basic |
|
$ |
( |
) |
|
$ |
( |
) |
Diluted |
|
$ |
( |
) |
|
$ |
( |
) |
|
|
|
|
|
|
|
||
Weighted-average shares outstanding: |
|
|
|
|
|
|
||
Basic |
|
|
|
|
|
|
||
Diluted |
|
|
|
|
|
|
||
The accompanying notes are an integral part of the consolidated financial statements.
22
GALAXY GAMING, INC.
CONSOLIDATED STATEMENTS OF CHANGES IN STOCKHOLDERS’ DEFICIT
YEARS ENDED DECEMBER 31, 2024 AND 2023
|
|
|
|
|
|
|
|
|
|
|
|
|
|
|
|
|
|
|
||||||
|
|
Common Stock |
|
|
Additional Paid-in |
|
|
Accumulated |
|
|
Accumulated Other Comprehensive |
|
|
Total Stockholders' |
|
|||||||||
|
|
Shares |
|
|
Amount |
|
|
Capital |
|
|
Deficit |
|
|
Loss |
|
|
Deficit |
|
||||||
Beginning balance, January 1, 2023 |
|
|
|
|
$ |
|
|
$ |
|
|
$ |
( |
) |
|
$ |
( |
) |
|
$ |
( |
) |
|||
Net loss |
|
|
— |
|
|
|
— |
|
|
|
— |
|
|
|
( |
) |
|
|
— |
|
|
|
( |
) |
Foreign currency translation income |
|
|
— |
|
|
|
— |
|
|
|
— |
|
|
|
— |
|
|
|
|
|
|
|
||
Stock options exercised |
|
|
|
|
|
|
|
|
|
|
|
— |
|
|
|
— |
|
|
|
|
||||
Stock-based compensation |
|
|
|
|
|
|
|
|
|
|
|
— |
|
|
|
— |
|
|
|
|
||||
Balance, December 31, 2023 |
|
|
|
|
$ |
|
|
$ |
|
|
$ |
( |
) |
|
$ |
( |
) |
|
$ |
( |
) |
|||
Net loss |
|
|
— |
|
|
|
— |
|
|
|
— |
|
|
|
( |
) |
|
|
— |
|
|
|
( |
) |
Foreign currency translation loss |
|
|
— |
|
|
|
— |
|
|
|
— |
|
|
|
— |
|
|
|
( |
) |
|
|
( |
) |
Surrender of options |
|
|
— |
|
|
|
— |
|
|
|
— |
|
|
|
— |
|
|
|
— |
|
|
|
— |
|
Stock options exercised |
|
|
|
|
|
|
|
|
|
|
|
— |
|
|
|
— |
|
|
|
|
||||
Stock-based compensation |
|
|
|
|
|
|
|
|
|
|
|
— |
|
|
|
— |
|
|
|
|
||||
Balance, December 31, 2024 |
|
|
|
|
$ |
|
|
$ |
|
|
$ |
( |
) |
|
$ |
( |
) |
|
$ |
( |
) |
|||
The accompanying notes are an integral part of the consolidated financial statements.
23
GALAXY GAMING, INC.
CONSOLIDATED STATEMENTS OF CASH FLOWS
YEARS ENDED December 31, 2024 AND 2023
|
|
Year Ended |
|
|||||
|
|
December 31, 2024 |
|
|
December 31, 2023 |
|
||
Cash flows from operating activities: |
|
|
|
|
|
|
||
Net loss |
|
$ |
( |
) |
|
$ |
( |
) |
Adjustments to reconcile net loss to net cash provided by operating activities: |
|
|
|
|
|
|
||
Depreciation and amortization |
|
|
|
|
|
|
||
Amortization of right-of-use assets |
|
|
|
|
|
|
||
Amortization of debt issuance costs and debt discount |
|
|
|
|
|
|
||
Bad debt (recovery) expense |
|
|
( |
) |
|
|
|
|
Loss on disposal of property & equipment |
|
|
|
|
|
— |
|
|
Deferred income tax |
|
|
( |
) |
|
|
( |
) |
Stock-based compensation |
|
|
|
|
|
|
||
Changes in operating assets and liabilities: |
|
|
|
|
|
|
||
Accounts receivable |
|
|
( |
) |
|
|
( |
) |
Income tax receivable |
|
|
( |
) |
|
|
|
|
Prepaid expenses and other current assets |
|
|
|
|
|
|
||
Other assets |
|
|
|
|
|
( |
) |
|
Accounts payable |
|
|
|
|
|
( |
) |
|
Accrued expenses |
|
|
|
|
|
( |
) |
|
Revenue contract liability |
|
|
( |
) |
|
|
|
|
Operating lease liabilities |
|
|
( |
) |
|
|
( |
) |
Net cash provided by operating activities |
|
|
|
|
|
|
||
Cash flows from investing activities: |
|
|
|
|
|
|
||
Investment in internally developed software |
|
|
( |
) |
|
|
( |
) |
Acquisition of property and equipment |
|
|
( |
) |
|
|
( |
) |
Acquisition of assets deployed at client locations |
|
|
( |
) |
|
|
( |
) |
Transfer of title of assets deployed at client locations to perpetual license customer |
|
|
|
|
|
|
||
Net cash used in investing activities |
|
|
( |
) |
|
|
( |
) |
Cash flows from financing activities: |
|
|
|
|
|
|
||
Payments of debt issuance costs |
|
|
— |
|
|
|
( |
) |
Proceeds from stock option exercises |
|
|
|
|
|
|
||
Principal payments on long-term debt |
|
|
( |
) |
|
|
( |
) |
Net cash used in financing activities |
|
|
( |
) |
|
|
( |
) |
Effect of exchange rate changes on cash |
|
|
( |
) |
|
|
|
|
Net increase (decrease) in cash and cash equivalents |
|
|
|
|
|
( |
) |
|
Cash and cash equivalents – beginning of period |
|
|
|
|
|
|
||
Cash and cash equivalents – end of period |
|
$ |
|
|
$ |
|
||
Supplemental cash flow information: |
|
|
|
|
|
|
||
Cash paid for interest |
|
$ |
|
|
$ |
|
||
Cash paid for income taxes |
|
$ |
|
|
$ |
|
||
Supplemental schedule of non-cash activities: |
|
|
|
|
|
|
||
Insurance acquired under note payable |
|
$ |
|
|
$ |
|
||
Right-of-use assets obtained in exchange for lease liabilities |
|
$ |
— |
|
|
$ |
|
|
The accompanying notes are an integral part of the consolidated financial statements.
24
GALAXY GAMING, INC.
NOTES TO CONSOLIDATED FINANCIAL STATEMENTS
YEARS ENDED DECEMBER 31, 2024 AND 2023
NOTE 1. NATURE OF OPERATIONS
Unless the context indicates otherwise, references to “Galaxy Gaming, Inc.,” “we,” “us,” “our,” or the “Company,” refer to Galaxy Gaming, Inc., a Nevada corporation (“Galaxy Gaming”).
We are an established global gaming company specializing in the design, development, acquisition, assembly, marketing and licensing of proprietary casino table games, side bets, and associated technology, platforms and systems for the casino and iGaming industries. Casinos use our proprietary products and services to enhance their gaming operations and improve their profitability and productivity, as well as to offer popular cutting-edge gaming entertainment content and technology to their players. We market our products and services to online and land-based casinos worldwide with products currently present in North America, the Caribbean, Central America, the United Kingdom, Europe and Africa, and to cruise ships exploring the world's oceans. We license our products and services for use in regulated land-based gaming markets. We also license our content and distribute content from other companies to iGaming operators in gaming markets throughout the world where iGaming is not illegal.
On
Upon the closing of the Merger, each share of common stock, par value $
Consummation of the Merger is subject to the satisfaction or waiver of certain closing conditions, including approval by at least a majority of the voting power of the outstanding shares of the Company’s common stock of the Merger Agreement and the transactions contemplated thereby, including the Merger, and the receipt of certain gaming regulatory approvals. At the special meeting of the Company’s stockholders held on November 12, 2024, stockholders voted to approve the Merger. The Merger is expected to be completed in mid-2025, subject to satisfaction or waiver of the closing conditions.
NOTE 2. SIGNIFICANT ACCOUNTING POLICIES
Basis of presentation. The accompanying consolidated financial statements have been prepared in accordance with generally accepted accounting principles in the United States of America (“U.S. GAAP”) and the rules of the U.S. Securities and Exchange Commission ("SEC"). In the opinion of management, the accompanying consolidated financial statements contain all necessary adjustments (including all those of a recurring nature and those necessary in order for the financial statements to not be misleading) and all disclosures to present fairly our financial position and the results of our operations and cash flows for the periods presented.
Basis of accounting. The consolidated financial statements have been prepared on the accrual basis of accounting in conformity with U.S. GAAP.
Use of estimates and assumptions. The preparation of financial statements in conformity with U.S. GAAP requires the Company to make decisions based upon estimates, assumptions, and factors considered relevant to the circumstances. Such decisions include the selection of applicable accounting principles and the use of judgment in their application, the results of which impact reported amounts and disclosures. Changes in future economic conditions or other business circumstances may affect the outcomes of the estimates and assumptions. Accordingly, actual results could differ materially from those anticipated.
Consolidation. The financial statements are presented on a consolidated basis and include the results of the Company and its wholly owned subsidiaries, Progressive Games Partner, LLC ("PGP") and Galaxy Gaming-01 LLC ("GG-01"). All intercompany transactions and balances have been eliminated in consolidation.
Reclassifications. Certain accounts and financial statement captions in the prior period have been reclassified to conform to the current period financial statement presentations and had no effect on net loss.
Cash and cash equivalents. Cash and cash equivalents consist primarily of deposits held at major banks and highly liquid investments with original maturities of three months or less. With the exception of funds held outside the U.S., these deposits are in insured banking institutions, which are insured up to $
25
Accounts receivable and allowance for credit losses. Accounts receivable are stated at face value net of allowance for credit losses. Management estimates the allowance for expected credit losses balance using relevant available information from internal and external sources, relating to past events, current conditions, and reasonable and supportable forecasts. Historical credit loss experience provides the basis for the estimation of expected credit losses. Adjustments to historical loss information are made for differences in the current environmental economic conditions and reasonable and supportable forecast. The allowance for expected credit losses on financial instruments is measured on a collective (pool) basis when similar risk characteristics exist. Accounts receivable are non-interest bearing. Accounts are written off when management deems them to be uncollectible. Recoveries of accounts previously written off are recorded when received.
For the years ended December 31, 2024 and 2023, there was
Assets deployed at client locations, net. Our Enhanced Table Systems are assembled by us and accounted for as assemblies in process until deployed at our casino clients’ premises. Assemblies in process are maintained at the Company and externally at third-party warehouses. Once deployed and placed into service at client locations, the assets are transferred from assemblies in process and reported as assets deployed at client locations. These assets are stated at cost, net of accumulated depreciation. Depreciation on assets deployed at client locations is calculated using the straight-line method over a three-year period and commences on the date they are transferred to the client location.
Property and equipment, net. Property and equipment are being depreciated over their estimated useful lives ( to
Goodwill. The excess of the purchase price of an acquired business over the estimated fair value of the assets acquired and the liabilities assumed, is recorded as goodwill. The Company tests for possible impairment of goodwill at least annually, or when circumstances change that would more likely than not reduce the fair value of a reporting unit below its carrying value. The Company has the option to begin with a qualitative assessment, commonly referred to as “Step 0”, to determine whether it is more likely than not that the reporting unit’s fair value of goodwill is less than its carrying value. This qualitative assessment may include, but is not limited to, reviewing factors such as the general economic environment, industry and market conditions, changes in key assumptions used since the most recently performed valuation and overall financial performance of the reporting units. If the Company determines that it is more likely than not that a reporting unit’s fair value is less than its carrying value, the Company performs a quantitative goodwill impairment analysis, and depending upon the results of that measurement, the recorded goodwill may be written down and charged to income from operations when the carrying amount of the reporting unit exceeds the fair value of the reporting unit.
Other intangible assets, net.
Patents |
|
Customer relationships |
|
Trademarks |
|
Intellectual property |
|
Non-compete agreements |
|
Software |
Software relates primarily to assets where costs are capitalizable during the application development phase. External and internal labor-related costs associated with product development are included in software. The Company reviews its identifiable intangible assets for impairment whenever events or changes in circumstances indicate that the carrying amount of an asset may not be recoverable. Impairment losses are recognized for identifiable intangibles, other than goodwill, when indicators of impairment are present and the estimated undiscounted cash flows are not sufficient to recover the assets’ carrying amount.
Fair value of financial instruments. Fair value is defined as a market-based measurement intended to estimate the price that would be received to sell an asset or paid to transfer a liability in an orderly transaction between market participants at the measurement date under current market conditions. Accounting Standards Board (“FASB”) Accounting Standards Codification (“ASC”) Topic 820, Fair Value Measurement (“ASC 820”). ASC 820 defines fair value, provides guidance for measuring fair value, requires certain disclosures and discusses valuation techniques, such as the market approach (comparable market prices), the income approach (present value of future income or cash flow) and the cost approach (cost to replace the service capacity of an asset or replacement cost). ASC 820 also establishes a fair value hierarchy, which requires an entity to maximize the use of observable inputs when measuring fair value. These inputs are categorized as follows:
26
The carrying values of cash equivalents, accounts receivable and accounts payable approximate fair value due to their short-term nature. The estimated fair value of our long-term debt approximates its carrying value based upon our expected borrowing rate for debt with similar remaining maturities and comparable risk (level 2). The Company currently has no financial instruments measured at estimated fair value on a recurring basis based on valuation reports provided by counterparties.
Leases. The Company classifies leases at inception as operating leases or finance leases in accordance with ASC 842, "Leases." We account for lease components (such as rent payments) separately from non-lease components (such as common-area maintenance costs, real estate and sales taxes and insurance costs). Operating and finance leases with terms greater than 12 months are recorded on the consolidated balance sheets as right-of-use assets with corresponding lease liabilities. Lease liabilities are amortized over the lease term using the effective interest method, while lease assets are depreciated over the shorter of the asset's useful life or the lease term. The discount rate used to determine present value is typically the incremental borrowing rate at lease commencement, unless the implicit rate in the lease is readily determinable. Subsequent changes in lease terms or payments are adjusted accordingly.
Revenue recognition. We account for our revenue in accordance with ASC Topic 606, Revenue from Contracts with Customers ("ASC 606").
Costs of ancillary products and assembled components. Ancillary products include pay tables (display of payouts), bases, layouts, signage and other items as they relate to support of specific proprietary games in connection with the licensing of our games. Assembled components represent the cost of the equipment, devices and incorporated software used to support our Enhanced Table Systems.
Research and development. Research and development costs related primarily to software product development costs and is expensed as incurred until ready for its intended use.
Foreign currency translation. The functional currency for PGP is the Euro. Gains and losses from settlement of transactions involving foreign currency amounts are included in other income or expense in the Consolidated Statements of Operations. Gains and losses resulting from translating assets and liabilities from the functional currency to U.S. dollars are included in accumulated other comprehensive loss in the Consolidated Statements of Changes in Stockholders’ Deficit.
Basic and diluted loss per share. Basic earnings per share is calculated by dividing net income by the weighted-average number of shares of common stock outstanding during the period. Diluted earnings per share is calculated by dividing net income by the weighted-average number of shares of common stock outstanding during the period increased to include the number of additional shares of common stock that would have been outstanding if the potentially dilutive securities had been issued. Potentially dilutive securities include outstanding stock options, shares to be purchased under the employee stock purchase plan, and unvested restricted stock units (“RSUs”).
Segment information. Operating segments are defined as components of our enterprise for which separate financial information is regularly reviewed by the Chief Operating Decision Maker ("CODM"), CEO, Matthew Reback, to assess performance and make operational decisions. Currently,
As of fiscal year 2024, the Company is adopting new segment expense disclosure requirements under Accounting Standards Update ("ASU") 2023-07.
Stock-based compensation. We recognize compensation expense for all restricted stock and stock option awards made to employees, directors and independent contractors. The fair value of restricted stock is measured using the closing price of our stock on the business day immediately preceding the grant date. The fair value of stock option awards is estimated using the Black-Scholes option-pricing model, and the portion that is ultimately expected to vest is recognized as compensation cost over the requisite service period. We have elected to recognize compensation expense for all options with graded vesting on a straight-line basis over the vesting period of the entire option. The determination of fair value using the Black-Scholes pricing model is affected by our stock price as well as assumptions regarding a number of complex and subjective variables, including expected stock price volatility, risk-free interest rate, expected dividends and projected employee stock option exercise behaviors. We estimate volatility based on historical volatility of our common stock, and estimate the expected term based on several criteria, including the vesting period of the grant and the term of the award. We estimate employee stock option exercise behavior based on actual historical exercise activity and assumptions regarding future exercise activity of unexercised, outstanding options.
27
Income taxes. We are subject to income taxes in both the United States and in certain non-U.S. jurisdictions. We account for income taxes in accordance with ASC 740, Accounting for Income Taxes (“ASC 740”), using the asset and liability method. Under the asset and liability method, deferred tax assets and liabilities are recognized for the future tax consequences attributable to temporary differences between the financial statement carrying amounts of existing assets and liabilities and their respective tax bases, and operating loss and tax credit carryforwards. These temporary differences will result in deductible or taxable amounts in future years when the reported amounts of the assets or liabilities are recovered or settled. Deferred tax assets and liabilities are measured using enacted tax rates expected to apply to taxable income in the years in which those temporary differences are expected to be recovered or settled. The effect on deferred tax assets and liabilities of a change in tax rates is recognized in income in the period that includes the enactment date. A valuation allowance is established when some or all of the Company's deferred tax assets do not meet the more-likely-than-not threshold of being realized. Adjustments to the valuation allowance increase or decrease our income tax provision or benefit. To the extent our analysis indicates that recovery is not more likely than not, we establish a valuation allowance against these deferred tax assets. Significant judgment is required in determining our provision for income taxes, our deferred tax assets and liabilities, and any valuation allowance recorded against our deferred tax assets. As of December 31, 2024, and 2023, we recorded a full valuation allowance against certain deferred assets.
In the ordinary course of business, there are transactions and calculations where the ultimate tax outcome is uncertain. Additionally, our tax returns are subject to audit by various tax authorities. Although we believe that our estimates are reasonable, actual results could differ from these estimates. We recognize the tax benefit from an uncertain tax position if it is more-likely-than-not that the tax position will be sustained on examination by the taxing authorities, based on an evaluation of the technical merits of the position, which requires a significant degree of judgment.
Recently issued accounting pronouncements. In November 2023, the Financial Accounting Standards Board (“FASB”) issued Accounting Standards Update 2023-07, “Improvements to Reportable Segment Disclosures,” (“ASU 2023-07”), which is effective for fiscal years beginning after December 15, 2023, and interim periods within fiscal years beginning after December 15, 2024, and requires retrospective application to all prior periods presented in the financial statements. ASU 2023-07 provides for improved financial reporting by requiring disclosure of incremental segment information to enable investors to develop more decision-useful financial analyses. The Company has included the adoption of this new accounting guidance in its consolidated financial statements and footnote disclosures. See Note 13.
Accounting Standard Update 2023-09, Improvements to Income Tax Disclosures ("ASU 2023-09"). In December 2023, the FASB issued ASU 2023-09, which requires more detailed income tax disclosures. The guidance requires entities to disclose disaggregated information about their effective tax rate reconciliation as well as expanded information on income taxes paid by jurisdiction. The disclosure requirements will be applied on a prospective basis, with the option to apply them retrospectively. The standard is effective for fiscal years beginning after December 15, 2024, with early adoption permitted. The Company is currently assessing the impact that adoption of this new accounting guidance will have on its consolidated financial statements and footnote disclosures.
Accounting Standard Update 2024-03, Disaggregation of Income Statement Expenses ("ASU 2024-03"). In November 2024, the FASB issued ASU 2024-03, which requires public business entities to disclose additional information about specific expense categories in the notes to financial statements at interim and annual reporting periods. The amendments in ASU 2024-03 are effective for annual reporting periods beginning after December 15, 2026, and interim reporting periods beginning after December 15, 2027. Early adoption is permitted. The Company is currently assessing the impact that adoption of this new accounting guidance will have on its consolidated financial statements and footnote disclosures.
We do not expect the adoption of recently issued accounting pronouncements to have a significant impact on our results of operations, financial position or cash flow.
28
NOTE 3. REVENUE RECOGNITION
Revenue recognition. We generate revenue primarily from the licensing of our intellectual property and the intellectual property that we license from third parties. We recognize revenue under recurring fee license contracts monthly as we satisfy our performance obligation, which consists of granting the customer the right to use our intellectual property. Amounts billed are determined based on flat rates or usage rates stipulated in the customer contract.
From time to time, we may sell the perpetual right to use our intellectual property for our progressive gaming systems, that is separate from the licensing of our game content and from time to time, sell the units used to deliver the progressive gaming systems. Control transfers and we recognize revenue at a point in time when the gaming system is available for use by a customer, which is no earlier than the shipment of the products to the customer or an intermediary for the customer.
From time to time, the Company licenses intellectual property from third-party owners and re-licenses that intellectual property to its casino clients. In these arrangements, the Company usually agrees to pay the owner of the intellectual property a royalty based on the revenues the Company receives from licensing the intellectual property to its casino clients. Depending on the relationship between Galaxy and the licensor, those royalties are either deducted from gross revenue to arrive at net revenue or are included in operating expenses.
Disaggregation of revenue.
|
|
Twelve Months |
|
|||||
|
|
2024 |
|
|
2023 |
|
||
The Americas |
|
$ |
|
|
$ |
|
||
Europe, Middle East and Africa |
|
|
|
|
|
|
||
Total revenue |
|
$ |
|
|
$ |
|
||
Contract liabilities. Amounts billed and cash received in advance of performance obligations fulfilled are recorded as contract liabilities and recognized as performance obligations are fulfilled.
On May 10, 2023, the Company and a customer entered into an amended and restated agreement (the “Agreement”). The Agreement amends and restates a previous agreement between the Company and the customer, dated June 2, 2015, for the provision of licenses for certain table game content and related intellectual property which the Company, succeeded to as successor in interest by merger with PGP.
The Agreement guarantees a minimum payment from the customer of €
Contract assets. The Company’s contract assets consist solely of unbilled receivables which are recorded when the Company recognizes revenue in advance of billings. Unbilled receivables are included in the balance of accounts receivable, net of allowance on the balance sheet and totaled $
Intellectual property agreements. From time to time, the Company purchases or licenses intellectual property from third-parties and the Company, in turn, utilizes that intellectual property in certain games licensed to clients. In these purchase agreements, the Company may agree to pay the seller of the intellectual property a fee if and when the Company receives revenue from games containing the intellectual property.
On June 8, 2023, the Company entered into a license and distribution agreement with a licensor, pursuant to which the Company licenses and has rights to distribute a game. The agreement contains definitions, representations and warranties, and terms that are customary in licensing agreements. The agreement is for a set term that may be extended on an annual basis at the end of the term. Customers under the distribution agreement generate revenue from the licensing of intellectual property. The agreement sets forth royalties to be paid to the licensor during the term and includes intellectual property licensing. The licensor has discretion in establishing the price for certain
29
game content to be re-licensed by the Company. The royalties due for this portion of the game content will be netted against revenue in our Consolidated Statement of Operations and Comprehensive Income (Loss).
Royalty agreements. For the years ended December 31, 2024 and 2023, license royalty payments of $
NOTE 4. PROPERTY AND EQUIPMENT
Property and equipment consisted of the following:
|
|
December 31, |
|
|
December 31, |
|
||
|
|
2024 |
|
|
2023 |
|
||
Furniture and fixtures |
|
$ |
|
|
$ |
|
||
Automotive vehicles |
|
|
|
|
|
|
||
Office and computer equipment |
|
|
|
|
|
|
||
Leasehold improvements |
|
|
|
|
|
|
||
Property and equipment, gross |
|
|
|
|
|
|
||
Less: accumulated depreciation |
|
|
( |
) |
|
|
( |
) |
Property and equipment, net |
|
$ |
|
|
$ |
|
||
For the years ended December 31, 2024, and 2023, depreciation expense related to property and equipment was $
NOTE 5. Assets deployed at client locations
Assets deployed at client locations, net consisted of the following:
|
|
December 31, |
|
|
December 31, |
|
||
|
|
2024 |
|
|
2023 |
|
||
Enhanced table systems |
|
$ |
|
|
$ |
|
||
Assemblies in process |
|
|
|
|
|
|
||
Less: accumulated depreciation |
|
|
( |
) |
|
|
( |
) |
Assets deployed at client location, net |
|
$ |
|
|
$ |
|
||
For the years ended December 31, 2024 and 2023, depreciation expense related to assets deployed at client locations was $
Assets deployed at client locations includes assemblies in process.
NOTE 6. OTHER INTANGIBLE ASSETS
Other intangible assets, net consisted of the following:
|
|
December 31, |
|
|
December 31, |
|
||
|
|
2024 |
|
|
2023 |
|
||
Patents |
|
$ |
|
|
$ |
|
||
Customer relationships |
|
|
|
|
|
|
||
Trademarks |
|
|
|
|
|
|
||
Intellectual property |
|
|
|
|
|
|
||
Non-compete agreements |
|
|
|
|
|
|
||
Software |
|
|
|
|
|
|
||
Other intangible assets, gross |
|
|
|
|
|
|
||
Less: accumulated amortization |
|
|
( |
) |
|
|
( |
) |
Other intangible assets, net |
|
$ |
|
|
$ |
|
||
30
For the years ended December 31, 2024 and 2023, amortization expense related to the finite-lived intangible assets was $
Estimated future amortization expense is as follows:
Years Ended December 31, |
|
Total |
|
|
2025 |
|
$ |
|
|
2026 |
|
|
|
|
2027 |
|
|
|
|
2028 |
|
|
|
|
2029 |
|
|
|
|
Thereafter |
|
|
|
|
Total |
|
$ |
|
|
NOTE 7. ACCRUED EXPENSES
Accrued expenses consisted of the following:
|
|
December 31, |
|
|
December 31, |
|
||
|
|
2024 |
|
|
2023 |
|
||
Commissions and royalties |
|
$ |
|
|
$ |
|
||
Payroll and related |
|
|
|
|
|
|
||
Interest |
|
|
- |
|
|
|
|
|
Other |
|
|
|
|
|
|
||
Total accrued expenses |
|
$ |
|
|
$ |
|
||
NOTE 8. LEASES
We have operating leases for our corporate office,
As of December 31, 2024, no renewal option periods were included in any estimated minimum lease terms as the options were not deemed reasonably certain to be exercised. Our leases have remaining lease terms ranging from
Supplemental balance sheet information related to leases is as follows:
|
|
Year Ended December 31, |
|
|||||
|
|
2024 |
|
|
2023 |
|
||
Operating leases: |
|
|
|
|
|
|
||
Operating lease right-of-use lease assets |
|
$ |
|
|
$ |
|
||
|
|
|
|
|
|
|
||
Operating lease current liabilities |
|
$ |
|
|
$ |
|
||
Operating lease long-term liabilities |
|
|
|
|
|
|
||
Total operating lease liabilities |
|
$ |
|
|
$ |
|
||
|
|
|
|
|
|
|
||
Weighted-average remaining lease term in years: |
|
|
|
|
|
|
||
Operating leases |
|
|
|
|
|
|
||
Weighted-average discount rate: |
|
|
|
|
|
|
||
Operating leases |
|
|
% |
|
|
% |
||
31
The components of lease expense are as follows:
|
|
Year Ended December 31, |
|
|||||
|
|
2024 |
|
|
2023 |
|
||
Operating lease cost (1) |
|
$ |
|
|
$ |
|
||
(1) Classified as selling, general and administrative expense |
|
|
|
|
|
|
||
Supplemental cash flow information related to leases is as follows:
|
|
Year Ended December 31, |
|
|||||
|
|
2024 |
|
|
2023 |
|
||
Cash paid for amounts included in the measurement of lease liabilities: |
|
|
|
|
|
|
||
Principal and interest payments related to operating leases |
|
$ |
|
|
$ |
|
||
|
|
|
|
|
|
|
||
Right-of-use assets obtained in exchange |
|
|
|
|
|
|
||
Operating leases |
|
$ |
— |
|
|
$ |
|
|
At December 31, 2024, future maturities of our operating lease liabilities are as follows:
|
|
Amount |
|
|
Years ended December 31, |
|
|
|
|
2025 |
|
$ |
|
|
2026 |
|
|
|
|
2027 |
|
|
|
|
Total minimum lease payments |
|
|
|
|
Less: imputed interest |
|
|
( |
) |
Total operating lease liability |
|
|
|
|
Less: current portion |
|
|
( |
) |
Long-term portion |
|
$ |
|
|
NOTE 9. LONG-TERM DEBT AND LIABILITIES
Long-term debt and liabilities consisted of the following:
|
December 31, |
|
|
December 31, |
|
||
|
2024 |
|
|
2023 |
|
||
Fortress credit agreement |
$ |
|
|
$ |
|
||
Insurance notes payable |
|
|
|
|
|
||
Long-term debt and liabilities, gross |
|
|
|
|
|
||
Less: Unamortized debt issuance costs |
|
( |
) |
|
|
( |
) |
Long-term debt and liabilities, net of debt issuance costs |
|
|
|
|
|
||
Less: Current portion of long-term debt |
|
( |
) |
|
|
( |
) |
Long-term debt and liabilities, net |
$ |
|
|
$ |
|
||
Fortress Credit Agreement. On November 15, 2021, the Company entered into a senior secured term loan agreement with Fortress Credit Corp. (“Fortress Credit Agreement”) in the amount of $
32
In connection with entering into the Fortress Credit Agreement, the Company also issued warrants to purchase a total of up to
In response to ASU No. 2020-04, Reference Rate Reform (Topic 848) and effective May 30, 2023, the Benchmark Replacement replaced LIBOR under the Fortress Credit Agreement. The Benchmark Replacement is (a) the sum of: (i) Term Secured Overnight Financing Rate ("SOFR") and (ii)
As of December 31, 2024, future maturities of our long-term obligations are as follows:
|
|
Total |
|
|
Years ended December 31, |
|
|
|
|
2025 |
|
$ |
|
|
2026 |
|
|
|
|
Long-term debt and liabilities, gross |
|
$ |
|
|
NOTE 10. COMMITMENTS AND CONTINGENCIES
Concentration of risk. We are exposed to risks associated with clients who represent a significant portion of total revenues.
For the years ended December 31, 2024 and 2023, we had the following client revenue concentrations:
|
|
Location |
|
2024 Revenue |
|
|
2023 Revenue |
|
|
Accounts |
|
|
Accounts |
|
||||
Client A |
|
Europe |
|
|
% |
|
|
% |
|
$ |
|
|
$ |
|
||||
Client B |
|
North America |
|
|
% |
|
|
% |
|
$ |
|
|
$ |
|
||||
Employment agreement amendment. On November 6, 2023, the “Company”, entered into an Employment Agreement, effective November 13, 2023, with Matt Reback to act as the Company’s President and Chief Executive Officer. The Agreement, among other things (i)
Mr. Reback replaced Todd Cravens, who was the President and Chief Executive Officer. Effective November 10, 2023, Mr. Cravens’ employment with the Company ended. In connection with the separation of Mr. Cravens’ employment with the Company, the Company and Mr. Cravens executed a severance agreement on
33
Company’s health plan, for up to 12 months, which ended December 2024, he did not elect extension coverage; (d) for providing transition services for the company, Mr. Cravens was paid $
On May 22, 2024, the Company, entered into an Employment Agreement, effective May 28, 2024, with Steven Kopjo, to become the Company’s Chief Financial Officer, and subject to applicable gaming regulatory approvals, Secretary and Treasurer. The Agreement, among other things (i)
Legal proceedings. In the ordinary course of conducting our business, we are, from time to time, involved in various legal proceedings, administrative proceedings, regulatory government investigations and other matters, including those in which we are a plaintiff or defendant, that are complex in nature and have outcomes that are difficult to predict.
An unexpected adverse judgment in any pending litigation could cause a material impact on our business operations, intellectual property, results of operations or financial position. Unless otherwise expressly stated, we believe costs associated with litigation will not have a material impact on our financial position or liquidity but may be material to the results of operations in any given period and, accordingly,
Beginning on September 11, 2024, seven purported stockholders of Galaxy have sent demands to the Company and two of which included draft complaints. On October 18, 2024,
Intellectual property agreements. From time to time, the Company purchases intellectual property from third-parties and the Company, in turn, utilizes that intellectual property in certain games licensed to clients. In these purchase agreements, the Company may agree to pay the seller of the intellectual property a fee, if and when, the Company receives revenue from games containing the intellectual property.
34
NOTE 11. INCOME TAXES
The components of the provision consist of the following for the years ended December 31, 2024 and 2023:
|
|
2024 |
|
|
2023 |
|
||
U.S. (loss) |
|
$ |
( |
) |
|
$ |
( |
) |
Non-U.S. income |
|
|
|
|
|
|
||
Loss before income taxes |
|
$ |
( |
) |
|
$ |
( |
) |
|
|
|
|
|
|
|
||
|
|
2024 |
|
|
2023 |
|
||
Current: |
|
|
|
|
|
|
||
Federal |
|
$ |
( |
) |
|
$ |
— |
|
State |
|
|
|
|
|
|
||
Foreign |
|
|
|
|
|
|
||
Total current |
|
|
|
|
|
|
||
Deferred: |
|
|
|
|
|
|
||
Federal |
|
|
|
|
|
( |
) |
|
State |
|
|
( |
) |
|
|
( |
) |
Total deferred |
|
|
( |
) |
|
|
( |
) |
Noncurrent: |
|
|
|
|
|
|
||
Federal |
|
|
( |
) |
|
|
— |
|
Total Noncurrent |
|
|
( |
) |
|
|
— |
|
Provision for income taxes |
|
$ |
|
|
$ |
|
||
The income tax provision differs from that computed at the federal statutory corporate income tax rate as follows for the years ended December 31, 2024 and 2023:
|
|
2024 |
|
|
2023 |
|
||
Tax provision computed at the federal statutory rate |
|
$ |
( |
) |
|
$ |
( |
) |
Foreign rate differential |
|
|
|
|
|
|
||
State income tax, net of federal benefit |
|
|
|
|
|
( |
) |
|
Share based compensation |
|
|
— |
|
|
|
( |
) |
Other permanent items |
|
|
|
|
|
|
||
Credits |
|
|
( |
) |
|
|
( |
) |
State tax true ups |
|
|
( |
) |
|
|
( |
) |
Other rate changes, net of benefit |
|
|
( |
) |
|
|
|
|
Change in valuation allowance |
|
|
|
|
|
|
||
Provision for income taxes |
|
$ |
|
|
$ |
|
||
35
The tax effects of significant temporary differences representing net deferred tax assets and liabilities consisted of the following at December 31, 2024 and 2023:
|
|
2024 |
|
|
2023 |
|
||
Deferred Tax Assets: |
|
|
|
|
|
|
||
Right-of-use asset |
|
$ |
|
|
$ |
|
||
Net operating loss |
|
|
|
|
|
|
||
Share based compensation |
|
|
|
|
|
|
||
Intangible assets |
|
|
|
|
|
|
||
Tax credits |
|
|
|
|
|
|
||
Capitalized R&D Cost |
|
|
|
|
|
|
||
Accruals and reserves |
|
|
|
|
|
|
||
Debt issuance costs |
|
|
|
|
|
|
||
Other |
|
|
|
|
|
|
||
Total deferred tax assets |
|
|
|
|
|
|
||
|
|
|
|
|
|
|
||
Total valuation allowance |
|
|
( |
) |
|
|
( |
) |
|
|
|
|
|
|
|
||
Deferred Tax Liabilities: |
|
|
|
|
|
|
||
Right-of-use liability |
|
|
( |
) |
|
|
( |
) |
Prepaid assets |
|
|
( |
) |
|
|
( |
) |
Basis difference in fixed assets |
|
|
( |
) |
|
|
( |
) |
Other |
|
|
( |
) |
|
|
( |
) |
Total deferred tax liabilities |
|
|
( |
) |
|
|
( |
) |
Net deferred tax liabilities |
|
$ |
( |
) |
|
$ |
( |
) |
As of December 31, 2024, the Company recognized federal and state net operating loss carryforwards of $
In accordance with U.S. GAAP, the need to establish a valuation allowance against deferred tax assets is assessed periodically based on a more-likely-than-not realization threshold. Appropriate consideration is given to all positive and negative evidence related to that realization. This assessment considers, among other matters, the nature, frequency and severity of recent losses; forecasts of future profitability; the duration of statutory carryforward periods; experience with tax attributes expiring unused; and tax planning alternatives. The weight given to these considerations depends upon the degree to which they can be objectively verified.
A significant piece of objective negative evidence evaluated was the
Upon assessing all of the relevant evidence, the Company determined it has not met the more-likely-than-not threshold to support the realization of all or part of its deferred tax assets. The Company has recorded a valuation allowance against certain of its deferreds in the amount of $
The aggregate changes in the balance of gross unrecognized tax benefits (included as part of deferred tax liabilities, net in the accompanying consolidated financial statements), which excludes interest and penalties, are as follows as of and for the years ended December 31, 2024 and 2023:
|
|
2024 |
|
|
2023 |
|
||
Beginning balance |
|
$ |
|
|
$ |
|
||
Decreases related to tax positions taken of the prior years |
|
|
( |
) |
|
|
|
|
Ending balance |
|
$ |
|
|
$ |
|
||
Our total liability for unrecognized gross tax benefits was $
36
remain subject to examination for fiscal years
NOTE 12. STOCK-BASED COMPENSATION
Stock Options
During the years ended December 31, 2024 and 2023, we issued
|
|
Options Issued For the Twelve Months Ended December 31, 2024 |
|
Options Issued For the Twelve Months Ended December 31, 2023 |
Dividend yield |
|
|
||
Expected volatility |
|
|
||
Risk-free interest rate |
|
|
||
Expected life (years) |
|
|
A summary of stock option activity is as follows:
|
|
Common |
|
|
Weighted- |
|
|
Weighted- |
|
|
Aggregate |
|
||||
Outstanding -- December 31, 2023 |
|
|
|
|
$ |
|
|
|
|
|
$ |
( |
) |
|||
Granted |
|
|
|
|
|
|
|
- |
|
|
|
— |
|
|||
Exercised |
|
|
( |
) |
|
|
|
|
|
- |
|
|
|
— |
|
|
Forfeited or expired |
|
|
( |
) |
|
|
|
|
|
- |
|
|
|
— |
|
|
Outstanding -- December 31, 2024 |
|
|
|
|
|
|
|
|
|
|
$ |
|
||||
Exercisable -- December 31, 2024 |
|
|
|
$ |
|
|
|
|
|
$ |
|
|||||
A summary of unvested stock option activity is as follows:
|
|
Common |
|
|
Weighted- |
|
|
Weighted- |
|
|
Aggregate |
|
||||
Unvested – December 31, 2023 |
|
|
|
|
$ |
|
|
|
|
|
$ |
( |
) |
|||
Granted |
|
|
|
|
|
|
|
— |
|
|
|
— |
|
|||
Vested |
|
|
( |
) |
|
|
|
|
|
— |
|
|
|
— |
|
|
Forfeited |
|
|
( |
) |
|
|
|
|
|
— |
|
|
|
— |
|
|
Unvested - December 31, 2024 |
|
|
|
|
$ |
|
|
|
|
|
$ |
|
||||
37
As of December 31, 2024, our unrecognized share-based compensation expense associated with the stock options issued was $
Restricted Stock Units
During the year ended December 31, 2024, we issued an aggregate of
On December 30, 2024, Mr. Reback received
On March 1, 2024, an employee received
At December 31, 2024 and 2023, unvested restricted shares were
NOTE 13. SEGMENT
We define operating segments as components of our enterprise for which separate financial information is reviewed regularly by the chief operating decision maker ("CODM"), CEO, Matthew Reback, to evaluate performance and make operating decisions. We currently have two revenue streams (land-based gaming and online gaming), which are aggregated into
As of fiscal year 2024, the Company is adopting the new requirements under ASU 2023-07, which mandates the disclosure of significant segment expenses. The Company determined the following significant expenses: cost of ancillary products and assembled components, selling, general and administrative, compensation and related expenses, research and development, depreciation and amortization, and stock-based compensation. The CODM reviews these significant expenses as provided in the monthly reporting package.
A summary of segment expense activity is as follows:
|
For the Year Ended December 31, |
|||||||
|
2024 |
|
|
2023 |
|
|
||
Revenue: |
|
|
|
|
|
|
||
Total Core Revenue |
$ |
|
|
$ |
|
|
||
Total Digital Revenue |
|
|
|
|
|
|
||
Consolidated Revenue |
$ |
|
|
$ |
|
|
||
|
|
|
|
|
|
|
||
Cost and expenses |
|
|
|
|
|
|
||
Cost of ancillary products and assembled components |
$ |
|
|
$ |
|
|
||
Selling, general and administrative |
|
|
|
|
|
|
||
Compensation and related expenses |
|
|
|
|
|
|
||
Research and development |
|
|
|
|
|
|
||
Depreciation and amortization |
|
|
|
|
|
|
||
Stock-based compensation |
|
|
|
|
|
|
||
Total costs and expenses |
$ |
|
|
$ |
|
|
||
|
|
|
|
|
|
|
||
Net loss |
$ |
( |
) |
|
$ |
( |
) |
|
38
NOTE 14. SUBSEQUENT EVENTS
On January 6, 2025, the Company entered into a credit agreement with BMO Bank N.A. ("BMO"), a national banking association. The credit agreement provides for senior secured financing in the aggregate amount of up to $
The new credit agreement replaces the Fortress Credit Agreement, which included a term loan with a maturity date of
Borrowings under the credit agreement bear interest at a rate equal to an applicable margin plus, at the Company’s option, either (1) at a floating rate equal to the base rate (the “Base Rate”) determined by reference to the greatest of: (a) the prime commercial rate announced or otherwise established by BMO, (b) the federal funds rate plus one half of
The credit agreement contains customary representations and warranties, affirmative and negative covenants and events of default. The credit agreement includes financial covenants requiring the Company to maintain a maximum Total Funded Debt to EBITDA Ratio, a minimum Fixed Charge Coverage Ratio, minimum EBITDA, and maximum Capital Expenditures (each as defined in the credit agreement).
The Company’s obligations under the credit agreement are guaranteed by the Company’s domestic subsidiaries, and secured by a first-priority security interest in substantially all of the tangible and intangible personal property of the Company and each subsidiary.
39
ITEM 9. CHANGES IN AND DISAGREEMENTS WITH ACCOUNTANTS ON ACCOUNTING AND FINANCIAL DISCLOSURE
None.
ITEM 9A. CONTROLS AND PROCEDURES
Disclosure Controls and Procedures
Disclosure controls and procedures are controls and other procedures that are designed to ensure that information required to be disclosed in our reports filed or submitted under the Exchange Act are recorded, processed, summarized and reported within the time periods specified in the SEC’s rules and forms. Disclosure controls and procedures include, without limitation, controls and procedures designed to ensure that information required to be disclosed in our reports submitted under the Exchange Act is accumulated and communicated to management including our Chief Executive Officer and Chief Financial Officer, to allow timely decisions regarding required disclosure.
We carried out an evaluation of the effectiveness of the design and operation of our disclosure controls and procedures (as defined in Exchange Act Rules 13a-15(e) and 15d-15(e)) as of the end of the period covered by this Annual Report. This evaluation was carried out under the supervision and with the participation of our Chief Executive Officer and our Chief Financial Officer. Based upon that evaluation, our Chief Executive Officer and Chief Financial Officer concluded that, as of December 31, 2024, our disclosure controls and procedures were effective.
Management's Annual Report on Internal Control Over Financial Reporting
Our internal control over financial reporting is a process designed by, or under the supervision of, our Chief Executive Officer and Chief Financial Officer and effected by our Board, management and other personnel, to provide reasonable assurance regarding the reliability of our financial reporting and the preparation of our financial statements for external purposes in accordance with generally accepted accounting principles. Internal control over financial reporting includes policies and procedures that pertain to the maintenance of records that in reasonable detail accurately and fairly reflect the transactions and dispositions of our assets; provide reasonable assurance that transactions are recorded as necessary to permit preparation of our financial statements in accordance with generally accepted accounting principles, and that our receipts and expenditures are being made only in accordance with the authorization of our Board and management; and provide reasonable assurance regarding prevention or timely detection of unauthorized acquisition, use or disposition of our assets that could have a material effect on our financial statements.
Under the supervision and with the participation of our management, including our Chief Executive Officer, we evaluated the effectiveness of our internal control over financial reporting based on the framework set forth in Internal Control – Integrated Framework issued in 2013 by the Committee of Sponsoring Organizations of the Treadway Commission (“COSO”). Based on this evaluation under the criteria established in Internal Control – Integrated Framework, our management concluded that our internal control over financial reporting was effective as of December 31, 2024.
This annual report is not required and does not include an attestation report of our registered public accounting firm regarding internal control over financial reporting.
Changes in Internal Control over Financial Reporting
No change in our internal control over financial reporting occurred during our last fiscal year that has materially affected, or is reasonably likely to materially affect, our internal control over financial reporting.
ITEM 9B. OTHER INFORMATION
ITEM 9C. DISCLOSURE REGARDING FOREIGN JURISDICTIONS THAT PREVENT INSPECTIONS
None.
40
PART III
ITEM 10. DIRECTORS, EXECUTIVE OFFICERS AND CORPORATE GOVERNANCE
Directors and executive officers. The following information sets forth the names of our directors and executive officers, their ages and their appointment date/years in position as of December 31, 2024.
Name |
|
Age |
|
Office(s) Held |
|
Years in Position/Date of Appointment or Commencement |
Matthew D. Reback |
|
55 |
|
President and Chief Executive Officer |
|
1 year/November 13, 2023 |
Steven J. Kopjo |
|
42 |
|
Chief Financial Officer, Secretary and Treasurer |
|
May 28, 2024 |
Mark A. Lipparelli |
|
59 |
|
Chairman of the Board |
|
7 years/July 26, 2017 |
Bryan W. Waters |
|
62 |
|
Director |
|
9 years/April 1, 2015 |
Cheryl A. Kondra |
|
51 |
|
Director |
|
3 years/December 2, 2021 |
Meredith Brill |
|
49 |
|
Director |
|
2 years/July 13, 2022 |
Michael Gavin Isaacs |
|
60 |
|
Former Director |
|
June 3, 2019 - August 30, 2024 |
Matthew D. Reback was appointed as our President and Chief Executive Officer on November 13, 2023. Mr. Reback served as the founder and President of Bravery Gaming. Prior thereto Mr. Reback held senior management positions in product management, sales, marketing and operations with AGS, Konami Gaming, Red Rock Casinos (formerly Station Casinos) and Caesars Entertainment. Mr. Reback is a graduate of UCLA and University of San Diego School of Law.
Steven J. Kopjo was appointed as our Chief Financial Officer, Secretary and Treasurer on May 28, 2024. Mr. Kopjo most recently served as the Vice President of Finance at Everi Holdings. Mr. Kopjo began his career at Ernst & Young, earning his CPA license. Mr. Kopjo has an extensive background in finance, accounting, and investor relations, having held key positions at prominent gaming companies, including AGS, Wynn Resorts, and SHFL entertainment (formerly Shuffle Master). Mr. Kopjo is a graduate of the University of Nevada, Las Vegas with a B.S. in Business Administration with a concentration in accounting.
Mark A. Lipparelli has been a Director and our Chairman since July 2017. Mr. Lipparelli currently serves as the Managing Member and Chief Executive Officer of GVII, LLC, a Nevada gaming licensee that manages the Westgate Resort Las Vegas; Managing Member of CAMS, LLC, a technology services company to the online gaming industry; and Managing Member of SBOpco, LLC, a sportsbook company operating as SuperBook. Additionally, Mr. Lipparelli serves as an advisor to various number of operating and investment entities through GVIII, LLC where he is the Managing Member and serves as a member of the Board of Directors of the General Commercial Gaming Regulatory Authority. Mr. Lipparelli has served as a member of the Board of Directors of Golden Entertainment, Inc. Mr. Lipparelli also formerly represented State Senate District 6 in the Nevada Legislature, having been appointed to the post in December 2014, and served on a number of Senate committees. Mr. Lipparelli has also been an appointee to the Nevada Gaming Policy Committee. Between 2009 and 2012, Mr. Lipparelli served as a Board Member and Chairman of the Nevada Gaming Control Board. Between 2002 and 2007, Mr. Lipparelli served in various executive management positions at Bally Technologies, Inc., a gaming technology supply company listed on the NYSE, including as Executive Vice President of Operations. Prior to joining Bally, Mr. Lipparelli served as Executive Vice President and then President of Shuffle Master, Inc., a publicly traded gaming supply company, from 2001 to 2003; as Chief Financial Officer of Camco, Inc., a retail chain holding company, from 2000 to 2001; as Senior Vice President of Entertainment Systems for Bally Gaming, Inc. (a subsidiary of publicly traded Alliance Gaming Corporation), from 1998 to 2000; and various management positions including Vice President of Finance for publicly traded Casino Data Systems from 1993 to 1998. Mr. Lipparelli is a Board Trustee Emeritus of the University of Nevada Foundation, Board Member of the International Center for Responsible Gaming, member of the International Association of Gaming Advisors and a member of the International Masters of Gaming Law. Mr. Lipparelli holds a bachelor’s degree in finance and a master’s degree in economics from the University of Nevada, Reno. The Board considers Mr. Lipparelli qualified to serve on the Board, as he brings over 25 years of experience in the gaming industry, including his service as Chief Executive Officer of a strategic advisory and product development firm and various executive management positions at companies serving the gaming industry. He also provides information security expertise to our Board of Directors through his leadership positions with technology services companies, and contributes his legislative experience with the State Senate and past roles with the Nevada Gaming Control Board.
Bryan W. Waters has been a Director since April 2015. Mr. Waters most recently was Interim CEO of Luminator Technology Group, a globally recognized leader in providing technology solutions that increase intelligence, safety and efficiency for public transit operators. The interim CEO role ended in June 2023. Mr. Waters also oversees Magnolia Lane Partners, LLC, an advisory and asset management firm and company he founded in 2012 and is active in advising several specialty finance entities. Mr. Waters previously served as CEO of Microf, LLC, a fin-tech platform and lease to own provider for the home improvement industry from June 2019
41
through September 2021. Mr. Waters served as President and Chief Operating Officer of Genesis Financial Solutions, the largest second look private label credit card issuer in the United States, from June 2016 to January 2018. Mr. Waters served as CEO of North America for Dollar Financial Group leading over 3000 employees throughout 850 finance centers from June 2015 through June 2016. In September of 2013, Mr. Waters assumed the role of Chief Executive Officer of CBV and served in that role until its successful sale in June 2015. Mr. Waters served on the Board of CBV Collection Services, LTD, a private equity and management owned company and one of the largest independent outsourcing, collection services and debt buying organizations in Canada, prior to his appointment as CEO. In 2010, Mr. Waters became Chief Executive Officer of B-Line, LLC, the largest purchaser and servicer of unsecured consumer bankruptcy claims in the country. At the time of its successful sale in late 2011, B-Line owned and serviced in excess of $300 million in assets. Mr. Waters joined Pacific National Bank, a privately held $2.3 billion 17 branch bank based in San Francisco, in 2006 as President and Chief Executive Officer until its sale to U.S. Bank in October 2009. In 2001, Mr. Waters became Chief Financial Officer of Camco, Inc., a specialty finance lender. Shortly after his appointment, Mr. Waters also absorbed the roles of President and Chief Operating Officer until the successful sale of the company in December 2005 to Cash America International, Inc. a NYSE listed company. A graduate of University of California, Los Angeles, Mr. Waters started his career with Wells Fargo Bank in 1988 where he held numerous executive positions throughout his 12 years with the bank, including President of the Southern Nevada region.
The Board considers Mr. Waters to be qualified to serve on the Board given his experience at running, successfully growing and exiting private equity sponsored companies and his skills at building and leading teams to achieve outstanding results using a combination of judgment, experience and enthusiasm.
Cheryl Kondra has been a Director since December 2021 and was named the Audit Committee Chairperson as of March 2022. Since June 2020, Ms. Kondra has served as Vice President of Internal Audit at Tractor Supply Company (NASDAQ:TSCO), the largest rural lifestyle retailer in the United States. Prior to Tractor Supply Company, she had an extensive career in gaming, having served as the VP of Internal Audit for Genting Americas from 2019-2020. Prior to that she was VP of Internal Audit and Chief Compliance Officer at Pinnacle Entertainment from October 2014 to September 2018. Ms. Kondra was the Chief Audit Executive at Caesars Entertainment from October 2007 to August 2014 and held various other positions with Harrah’s and Caesars Entertainment since 1997 within the Internal Audit and Compliance functions. Ms. Kondra has a Master of Accountancy degree and an undergraduate degree in Accounting. Ms. Kondra is a Certified Internal Auditor.
The Board considers Ms. Kondra qualified to serve on the Board based on her more than 25 years’ experience in the gaming industry and audit/compliance field, including in executive and leadership positions, and her ability to build strong teams to address the many audit, Sarbanes Oxley compliance, regulatory and legal issues impacting companies in the gaming sector. As a global audit and compliance leader, Ms. Kondra has earned a reputation for agile, ethical leadership among external auditors, colleagues, and clients for handling domestic and international audit and compliance requirements in publicly traded, startup, and PE-owned companies. A board presenter, team builder, industry speaker, and influential executive often sought to build and strengthen internal audit, she has achieved notable cost savings, with concurrent advances in risk identification, audit integrity, budget reductions, staff empowerment, and standards at Caesars Entertainment, Pinnacle Entertainment, Genting Americas, and Tractor Supply Company.
Meredith Brill is a Director and was appointed to the Board effective July 13, 2022. A graduate of the University of Toronto, Ms. Brill earned a Bachelor's Degree in Applied Science & Engineering in 1997 and a Law Degree from Osgoode Hall at York University in 2000. Ms. Brill is a private investor who focuses on evaluating special situation investments and unique business models. Prior to shifting to investing, she was an experienced Canadian intellectual property lawyer and Patent Agent with a chemical engineering background. Her legal career included all aspects of patent drafting and prosecution, intellectual property portfolio and management strategy, and competitive intelligence research.
The Board considers Ms. Brill’s extensive private investment experience and legal career with a heavy focus on patents and intellectual property qualifies her to serve on the Board.
Michael Gavin Isaacs is a former Director who served as our Compensation Committee Chairperson from June 2019 through August 2024. Mr. Isaacs is also currently a Non-Executive Board of Director of Games Global, Ltd., a company operating in the iGaming area providing content to iGaming operators in regulated markets, and a former gaming industry advisor to Jackpocket, an online lottery app, and PureSoftware, an India-based developer and talent source. Mr. Isaacs previously served as Vice Chairman of the Board of Scientific Games Corporation (“Scientific Games”), a global leader in lottery games and sports betting and technology, from August 2016 until December 2018, and prior to that was a member of the Board of Directors and President and Chief Executive Officer of Scientific Games from June 2014 until August 2016. During his tenure at Scientific Games, Mr. Isaacs oversaw a gaming and lottery entertainment powerhouse that operated under a portfolio of successful brands, including Bally, Barcrest, Global Draw, SG Lottery, Shuffle Master and WMS. Mr. Isaacs was instrumental in Scientific Games’ $5.1 billion acquisition of Bally Technologies in 2014 and in a two-year span helped grow annual revenues from $1.3 billion to $2.9 billion, reflecting a 100 percent increase in social revenue growth which positioned Scientific Games as the No. 2 ranked global social interactive business. Prior to 2014, Mr. Isaacs served as Chief Executive Officer of SHFL Entertainment, Inc. and served as Executive Vice President and Chief Operating Officer of Bally from 2006 through 2011. In 2012, Mr. Isaacs played a key role in Bally’s $1.3 billion acquisition of SHFL entertainment and was pivotal in merging four
42
companies (Scientific Games, Bally, SHFL and WMS) into a single, innovation-driven organization focused on empowering customers by creating the world’s best gaming and lottery experiences. Prior to joining Bally, he held senior roles and key management positions at Aristocrat Leisure Limited (“Aristocrat”) for eight years, including General Manager, Legal and Compliance; General Manager, Marketing and Business Development; and Managing Director, Europe, before becoming Aristocrat’s Americas President in 2003. Mr. Isaacs was a former Non-Executive Director of DraftKings Inc. (NASDAQ:DKNG) from April 2020 to April 2021, and former Chairman of SBTech from January 2019 to April 2020. Mr. Isaacs previously served as a Trustee and the President of the International Association of Gaming Advisors, and as Vice Chairman of the board of directors of the American Gaming Association. Mr. Isaacs has a Masters of Laws degree and an undergraduate degree in Accounting and Financial Systems. Mr. Isaacs brings to the Company experience on public boards of directors and a proven track record of success in leading company turnarounds and establishing companies on strong growth trajectories.
Our bylaws authorize no fewer than one and no more than thirteen directors. We currently have four directors.
Family relationships. There are no family relationships between or among the directors, executive officers or persons nominated or chosen by us to become directors or executive officers.
Director or officer involvement in certain legal proceedings. To the best of our knowledge, during the past ten years, none of the following occurred with respect to any of our present or former directors or executive officers: (1) any bankruptcy petition filed by or against any business of which such person was a general partner or executive officer either at the time of the bankruptcy or within two years prior to that time; (2) any conviction in a criminal proceeding or being subject to a pending criminal proceeding (excluding traffic violations and other minor offenses); (3) being subject to any order, judgment or decree, not subsequently reversed, suspended or vacated, of any court of any competent jurisdiction, permanently or temporarily enjoining, barring, suspending or otherwise limiting his involvement in any type of business, securities or banking activities; and (4) being found by a court of competent jurisdiction (in a civil action), the Securities and Exchange Commission or the Commodities Futures Trading Commission to have violated a federal or state securities or commodities law, and the judgment has not been reversed, suspended or vacated.
Committees of the Board. We do not currently have a separate executive committee or stock plan committee of our Board of Directors.
Compensation Committee. Pursuant to the Charter, the Compensation Committee is to be comprised of no fewer than two non-employee members of the Board, and the members shall be free from any relationships or conflicts of interest with respect to the Company that would impair the member’s ability to make independent judgments. The members of the Compensation Committee will be appointed by the Board and can be removed by the Board at any time, with or without cause.
The authority and duties of the Compensation Committee include but are not limited to approving the corporate goals and objectives relating to compensation and bonus incentive structure of the Chief Executive Officer and other executive officers and key employees and any company-wide bonus plans; approving any material grants of equity compensation; retaining and terminating any compensation consultant; and reviewing and assessing the adequacy of the Charter.
The members of the Compensation Committee include Mr. Lipparelli and Mr. Waters.
Audit Committee. The Audit Committee met four times during 2024. We have determined that each member of the Audit Committee qualifies as an "independent director" under OTCQB requirements.
The duties of the Audit Committee include but are not limited to: approving the selection of our independent accountants and meeting and interacting with the independent accountants to discuss issues related to financial reporting. In addition, the Audit Committee reviews the scope and results of the audit with the independent accountants, reviews with management and the independent accountants our annual operating results, considers the adequacy of our internal accounting procedures and considers other auditing and accounting matters including fees to be paid to the independent auditor and the performance of the independent auditor. The Audit Committee regularly holds executive sessions with the Company’s independent auditors and internal controls consultants at its regular quarterly meetings.
The members of the Audit Committee include Ms. Kondra, Mr. Waters, and Ms. Brill. Mr. Isaacs resigned effective August 30, 2024.
Nominating Committee. Our Board does not maintain a nominating committee. As a result, no written charter governs the director nomination process. The size of our Board, at this time, does not require a separate nominating committee. There were no changes during the year ended December 31, 2024, or as of the date of this report, to the process for recommending nominees to our Board.
When evaluating director nominees, our Board consider the following factors:
(1) The appropriate size of our Board;
(2) Our needs with respect to the particular talents and experience of our directors;
43
(3) The knowledge, skills and experience of nominees, including experience in finance, administration or public service, in light of prevailing business conditions and the knowledge, skills and experience already possessed by other members of the Board;
(4) Experience in political affairs;
(5) Experience with accounting rules and practices; and
(6) The desire to balance the benefit of continuity with the periodic injection of the fresh perspective provided by new Board members.
Our goal is to assemble a Board that brings together a variety of perspectives and skills derived from high quality business and professional experience. In doing so, the Board will also consider candidates with appropriate non-business backgrounds. Other than the foregoing, there are no stated minimum criteria for director nominees, although the Board may also consider such other factors as it may deem are in our best interests as well as our stockholders. In addition, the Board identifies nominees by first evaluating the current members of the Board willing to continue in service. Current members of the Board with skills and experience that are relevant to our business and who are willing to continue in service are considered for re-nomination. If any member of the Board does not wish to continue in service or if the Board decides not to re-nominate a member for re-election, the Board then identifies the desired skills and experience of a new nominee in light of the criteria above. Current members of the Board are polled for suggestions as to individuals meeting the criteria described above. The Board may also engage in research to identify qualified individuals. To date, we have not engaged third parties to identify or evaluate or assist in identifying potential nominees, although we reserve the right in the future to retain a third-party search firm, if necessary. The Board does not typically consider shareholder nominees because it believes that our current nomination process is sufficient to identify directors who serve our best interests.
Code of Ethics. As of December 31, 2024, the Company has not adopted a Code of Ethics for our principal executives, which would include our principal executive officer, principal financial officer, principal accounting officer or controller, or persons performing similar functions. The Company does have in place a new code of conduct which is included in its employee handbook, among other polices. The code of conduct and all other policies within the employee handbook are to be followed by all employees.
Section 16(a) beneficial ownership reporting compliance. Section 16(a) of the Exchange Act requires our directors and executive officers and persons who beneficially own more than ten percent of a registered class of our equity securities to file with the SEC initial reports of ownership and reports of changes in ownership of common stock and other equity securities. Officers, directors and greater than ten percent beneficial shareholders are required by SEC regulations to furnish us with copies of all Section 16(a) forms they file. To the best of our knowledge based solely on a review of Forms 3, 4, and 5 (and any amendments thereof) received by us during or with respect to the year ended December 31, 2024, there were no reports that were not filed on a timely basis.
Insider Trading Policy. We
Timing of Equity Awards.
ITEM 11. EXECUTIVE COMPENSATION
Compensation discussion and analysis. Our current executive compensation plan consists of cash, stock and/or stock options compensation to the executive officers, who are primarily responsible for the day-to-day management and continuing development of our business.
44
Summary compensation table. The table below summarizes all compensation awarded to or earned by each named executive officer for each of the last two completed fiscal years.
SUMMARY COMPENSATION TABLE |
||||||||||||||||||
Name and Principal Position |
|
Year |
|
Salary |
|
Bonus |
|
Stock |
|
Option |
|
Non-equity |
|
Non-qualified |
|
All Other |
|
Total |
Matthew D. Reback (2) |
|
2024 |
|
$350,000 |
|
$175,000 |
|
$194,600 |
|
— |
|
— |
|
— |
|
$42,574 |
|
$762,174 |
Steven J. Kopjo (3) |
|
2024 |
|
$138,461 |
|
— |
|
— |
|
$254,008 |
|
— |
|
— |
|
$8,931 |
|
$401,400 |
Harry C. Hagerty (4) |
|
2024 |
|
$147,385 |
|
$122,400 |
|
— |
|
— |
|
— |
|
— |
|
$21,273 |
|
$291,058 |
Todd P. Cravens |
|
2024 |
|
— |
|
— |
|
— |
|
— |
|
— |
|
— |
|
$332,260 |
|
$332,260 |
Outstanding equity awards at fiscal year-end table. The following table summarizes all unexercised options, stock that has not vested, and equity incentive plan awards outstanding for each named executive officer as of December 31, 2024.
OUTSTANDING EQUITY AWARDS AT FISCAL YEAR-END |
|
|||||||||||||||||||||||||||||||||||
OPTION AWARDS |
|
|
STOCK AWARDS |
|
||||||||||||||||||||||||||||||||
Name |
|
Number of |
|
|
Number of |
|
|
Equity Incentive Plan Awards: Number of Securities Underlying Unexercised Unearned Options |
|
|
Option Exercise Price |
|
|
Option Expiration Date |
|
|
Number of |
|
|
Market Value of Shares or Units of Stock That Have Not Vested |
|
|
Equity Incentive Plan Awards: Number of Unearned Shares, Units or Other Rights That Have Not Vested |
|
|
Equity Incentive Plan Awards: Market or Payout Value of Unearned Shares, Units or Other Rights That Have Not Vested |
|
|||||||||
Matthew D. Reback, CEO (1) |
|
|
100,000 |
|
|
|
300,000 |
|
|
|
— |
|
|
$1.80 |
|
|
11/13/2028 |
|
|
|
— |
|
|
|
— |
|
|
|
— |
|
|
|
— |
|
||
Steven J. Kopjo, CFO (2) |
|
|
— |
|
|
|
300,000 |
|
|
|
— |
|
|
$1.50 |
|
|
5/28/2029 |
|
|
|
— |
|
|
|
— |
|
|
|
— |
|
|
|
— |
|
||
Harry C. Hagerty, Fomer CFO |
|
|
200,000 |
|
|
|
— |
|
|
|
— |
|
|
$3.91 |
|
|
1/3/2027 |
|
|
|
— |
|
|
|
— |
|
|
|
— |
|
|
|
— |
|
||
Todd P. Cravens, Former CEO |
|
|
— |
|
|
|
— |
|
|
|
— |
|
|
|
— |
|
|
|
— |
|
|
|
— |
|
|
|
— |
|
|
|
— |
|
|
|
— |
|
45
Compensation of directors table. Board compensation is paid 60% in cash and 40% in stock. Board compensation targets are agreed upon and voted on annually. For the year ended December 31, 2024, the annual compensation target is $127,500 for each non-employee director. Additionally, for 2024, the annual compensation target is $170,000 for the Chair of our Board of Directors and $148,750 for the Audit Committee Chair. The table below summarizes all compensation paid to each named director for the last completed fiscal year.
DIRECTOR COMPENSATION TABLE |
|
|||||||||||||||||||||||||||
Name |
|
Fees Earned or Paid in Cash |
|
|
Stock Awards |
|
|
Option Awards |
|
|
Non-equity Incentive Plan Compensation |
|
|
Non-qualified Deferred |
|
|
All Other |
|
|
Total |
|
|||||||
Mark A. Lipparelli(1) |
|
$ |
102,000 |
|
|
$ |
65,942 |
|
|
$ |
— |
|
|
$ |
— |
|
|
$ |
— |
|
|
$ |
— |
|
|
$ |
167,942 |
|
Bryan W. Waters(2) |
|
$ |
76,500 |
|
|
$ |
49,457 |
|
|
$ |
— |
|
|
$ |
— |
|
|
$ |
— |
|
|
$ |
— |
|
|
$ |
125,957 |
|
Cheryl A. Kondra(3) |
|
$ |
89,250 |
|
|
$ |
57,700 |
|
|
$ |
— |
|
|
$ |
— |
|
|
$ |
— |
|
|
$ |
— |
|
|
$ |
146,950 |
|
Meredith Brill(4) |
|
$ |
76,500 |
|
|
$ |
49,457 |
|
|
$ |
— |
|
|
$ |
— |
|
|
$ |
— |
|
|
$ |
— |
|
|
$ |
125,957 |
|
Michael Gavin Isaacs(5) |
|
$ |
51,000 |
|
|
$ |
32,486 |
|
|
$ |
— |
|
|
$ |
— |
|
|
$ |
— |
|
|
$ |
— |
|
|
$ |
83,486 |
|
Reback Employment Agreement. We have entered into an employment agreement with Matt Reback to serve as our President and Chief Executive Officer. The Reback employment agreement has a three-year term; and provides for a base salary of $350,000 per year, an annual discretionary bonus target of up to 50% of his base salary, with the opportunity to earn additional amounts if certain financial objectives are achieved, and eligibility to participate in the employee benefit plans available to our employees. Under the Reback employment agreement, we agreed to pay a minimum bonus of $80,000 to Mr. Reback for the 2024 calendar year if 80% of the annual bonus target is achieved. Under the Reback employment agreement, Mr. Reback received a stock award that is eligible to vest based on achievement of performance-based vesting conditions (the “Long-Term Incentive Stock Grant”). The award is eligible to vest based on personal and business performance targets to be established by the Board for each of 2024, 2025 and 2026. The targets, if achieved, will provide Mr. Reback the opportunity to receive a total of 70,000 shares of common stock for calendar year 2024, 100,000 shares of common stock for calendar year 2025, and 130,000 shares of common stock for calendar year 2026, with final vesting determined following the assessment of achievement of the performance objectives during the first quarter of the following calendar year. To the extent any portion of this stock award remains outstanding at the effective time of the merger with Evolution Malta Holding Limited, such portion will convert into a contingent cash award at the effective time and will remain subject to the same vesting conditions, subject to the acceleration terms described below.
The Reback employment agreement provides that upon termination of employment by Mr. Reback for good reason or by the Company for any reason other than Mr. Reback’s death or disability or other than for cause, Mr. Reback is entitled to receive cash severance payments equal to 12 months of his annual base salary at the time of termination and continuation of his medical and health insurance
46
benefits for a period equal to the lesser of (x) 12 months and (y) the period ending on the date he first becomes entitled to medical and health insurance benefits under any plan maintained by any person for whom Mr. Reback provides services as an employee or otherwise. In addition to the foregoing severance benefits, if Mr. Reback’s employment is terminated without cause following a change of control (including the merger with Evolution Malta Holding Limited), he is also entitled to: (i) additional cash severance payments equal in the aggregate to 12 months of his annual base salary at the time of termination and (ii) accelerated vesting of his “base” stock options granted under the Reback employment agreement. In addition, if the effective time occurs and Mr. Reback is not retained or is not provided the continuing opportunity to earn his stock award (or any contingent cash award issued to Mr. Reback in consideration of his stock award at the effective time), Mr. Reback will vest in the earned portion of such award (for any calendar year completed prior to the effective time) or if a calendar year is not yet complete (or has not commenced) as of the effective time of the merger Evolution Malta Holding Limited, the remaining unearned portion of the award.
On December 27, 2024, the Reback employment agreement was amended to provide for, among other things, (i) the accelerated vesting of certain of Mr. Reback’s performance-based equity awards granted pursuant to our 2014 Equity Incentive Plan on December 31, 2024, resulting in the vesting of 70,000 shares of common stock for calendar year 2024, and (ii) an accelerated bonus payment of $175,000 payable prior to December 31, 2024, in each case, subject to the conditions set forth in the amendment to the Reback employment agreement.
Kopjo Employment Agreement. We have entered into an employment agreement with Steven Kopjo, effective May 28, 2024. The Kopjo employment agreement provides for, among other things (i) a three-year term; (ii) a base compensation of $250,000 per year; (iii) annual bonus opportunities of up to 50% of his base salary based on the achievement of certain performance metrics as determined by the Board; and (iv) upon execution of the agreement, a grant of options to purchase 300,000 shares of our common stock with a strike price equal to the price per share as reported on OTC Markets on the date of grant. The option will vest in equal installments over a three-year period, commencing on May 28, 2025.
The Kopjo employment agreement provides that upon termination of employment by Mr. Kopjo for good reason or by the Company for any reason other than Mr. Kopjo’s death or disability or other than for cause, Mr. Kopjo is entitled to receive cash severance payments equal to 12 months of his annual base salary at the time of termination and continuation of his medical and health insurance benefits for a period equal to the lesser of (x) 12 months and (y) the period ending on the date he first becomes entitled to medical and health insurance benefits under any plan maintained by any person for whom Mr. Kopjo provides services as an employee or otherwise. In addition to the foregoing severance benefits, if Mr. Kopjo’s employment is terminated without cause following a change of control, he is also entitled to: (i) additional cash severance payments equal in the aggregate to 12 months of his annual base salary at the time of termination and (ii) accelerated vesting of his “base” stock options granted under the Kopjo employment agreement.
Hagerty Employment Agreement. We have entered into an employment agreement with Harry C. Hagerty, our former Chief Financial Officer and a current advisor to the Company. The Hagerty employment agreement has a term ending April 30, 2025, after which he intends to retire. The Hagerty agreement provides that Mr. Hagerty will serve as a strategic advisor during the remaining term of the agreement to assist with the transition to the Company of his successor, Steven Kopjo. Pursuant to the Hagerty employment agreement, Mr. Hagerty will continue to receive a base salary of $6,000 per month until April 30, 2025 unless his service is earlier terminated. In the event Mr. Hagerty is terminated without cause or terminates his employment for good reason, Mr. Hagerty is entitled to receive cash severance payments equal to 12 months of his annual base salary at the time of termination and continuation of his medical and health insurance benefits for a period equal to the lesser of (x) 12 months and (y) the period ending on the date he first becomes entitled to medical and health insurance benefits under any plan maintained by any person for whom Mr. Hagerty provides services as an employee or otherwise. In addition to the foregoing severance benefits, if Mr. Hagerty’s employment is terminated without cause following a change of control, he is also entitled to: (i) additional cash severance payments equal in the aggregate to 12 months of his annual base salary at the time of termination and (ii) accelerated vesting of his stock options.
Cravens Separation Agreement. In connection with the separation of Mr. Cravens’ employment as CEO effective November 10, 2023, we entered into a separation, confidentiality and general release agreement with Mr. Cravens, which provides for, among other things, salary continuation of $325,000 payable over 26 biweekly payments, and an extended ability to exercise certain vested options.
47
PAY VERSUS PERFORMANCE
As required by Section 953(a) of the Dodd-Frank Wall Street Reform and Consumer Protection Act, and Item 402(v) of Regulation S-K, we are providing the following information about the relationship between executive compensation actually paid and certain financial performance measures of the Company. The disclosure included in this section is prescribed by SEC rules and does not necessarily align with how the Company or the Compensation Committee view the link between the Company’s performance and named executive officer pay. For further information regarding our compensation philosophy and how we seek to align executive compensation with the Company’s performance, refer to “Executive Compensation.”
Pay versus performance table. The following table sets forth information concerning the compensation, as calculated under SEC rules, of our named executive officers ("NEOs"), which include our current CEO, Matthew D. Reback, our current CFO, Steven J. Kopjo, our former CEO, Todd P. Cravens, and our former CFO, Harry C. Hagerty, for each of the fiscal years ended December 31, 2024, 2023, and 2022, and our financial performance for each such fiscal year:
Year |
|
Summary Compensation Table Total for Current PEO - Matthew Reback (1)(2) |
|
|
Summary Compensation Table Total for Former PEO – Todd Cravens (1)(3) |
|
|
Compensation Actually Paid to Current PEO - Matthew Reback (2)(4) |
|
|
Compensation Actually Paid to Former PEO - Todd Cravens (3)(4) |
|
|
Average Summary Compensation Table Total for Current Non-PEO NEOs (5) |
|
|
Average Summary Compensation Table Total for Former Non-PEO NEOs (5) |
|
|
Average Compensation Actually Paid to Current Non-PEO NEOs (6) |
|
|
Average Compensation Actually Paid to Former Non-PEO NEOs (6) |
|
|
Value of Initial Fixed $100 Investment Based on Total Shareholder Return ($) (7)(8) |
|
|
Net (Loss) Income (9) |
|
|
Adjusted EBITDA (9) |
|
|||||||||||
2024 |
|
$ |
762,174 |
|
|
$ |
332,260 |
|
|
$ |
1,042,137 |
|
|
$ |
332,260 |
|
|
$ |
401,400 |
|
|
$ |
291,058 |
|
|
$ |
729,702 |
|
|
$ |
261,308 |
|
|
$ |
71 |
|
|
$ |
(2,627,110 |
) |
|
$ |
13,040,932 |
|
2023 |
|
$ |
446,896 |
|
|
$ |
613,172 |
|
|
$ |
473,281 |
|
|
$ |
564,035 |
|
|
- |
|
|
$ |
322,173 |
|
|
- |
|
|
$ |
276,440 |
|
|
$ |
49 |
|
|
$ |
(1,807,586 |
) |
|
$ |
10,634,869 |
|
||
2022 |
|
- |
|
|
$ |
670,298 |
|
|
- |
|
|
$ |
513,025 |
|
|
- |
|
|
$ |
823,146 |
|
|
- |
|
|
$ |
618,668 |
|
|
$ |
62 |
|
|
$ |
(1,773,189 |
) |
|
$ |
10,534,484 |
|
||||
PEO |
|
Year |
|
|
Reported Summary Compensation Table Total for PEO |
|
|
Deduct Reported Value of Equity Awards (a) |
|
|
Add Equity Award Adjustments (b) |
|
|
Compensation Actually Paid to PEO |
|
|||||
Matthew Reback |
|
|
2024 |
|
|
$ |
762,174 |
|
|
$ |
194,600 |
|
|
$ |
474,563 |
|
|
$ |
1,042,137 |
|
Matthew Reback |
|
|
2023 |
|
|
$ |
446,896 |
|
|
$ |
410,863 |
|
|
$ |
437,248 |
|
|
$ |
473,281 |
|
Matthew Reback |
|
|
2022 |
|
|
- |
|
|
- |
|
|
- |
|
|
- |
|
||||
Todd Cravens |
|
|
2024 |
|
|
$ |
332,260 |
|
|
- |
|
|
- |
|
|
$ |
332,260 |
|
||
Todd Cravens |
|
|
2023 |
|
|
$ |
613,172 |
|
|
$ |
50,000 |
|
|
$ |
863 |
|
|
$ |
564,035 |
|
Todd Cravens |
|
|
2022 |
|
|
$ |
670,298 |
|
|
$ |
121,312 |
|
|
$ |
(35,961 |
) |
|
$ |
513,025 |
|
48
PEO |
|
Year |
|
|
Year End Fair Value of Outstanding and Unvested Equity Awards Granted in the Year |
|
|
Change in Fair Value as of the End of the Year of Outstanding and Unvested Equity Awards Granted in Prior Years |
|
|
Fair Value as of Vesting Date of Equity Awards Granted and Vested in the Year |
|
|
Change in Fair Value as of the Vesting Date of Equity Awards Granted in Prior Years that Vested in the Year |
|
|
Fair Value at the End of the Prior Year of Equity Awards that Failed to Meet Vesting Conditions in the Year |
|
Value of Dividends of or other Earnings Paid on Stock or Option Awards not Otherwise Reflected in Fair Value |
|
Total Equity Award Adjustments |
|
||||||
Matthew Reback |
|
|
2024 |
|
|
- |
|
|
$ |
203,727 |
|
|
$ |
194,600 |
|
|
$ |
76,236 |
|
|
- |
|
- |
|
$ |
474,563 |
|
|
Matthew Reback |
|
|
2023 |
|
|
$ |
437,248 |
|
|
- |
|
|
- |
|
|
- |
|
|
- |
|
- |
|
$ |
437,248 |
|
|||
Matthew Reback |
|
|
2022 |
|
|
- |
|
|
- |
|
|
- |
|
|
- |
|
|
- |
|
- |
|
- |
|
|||||
Todd Cravens |
|
|
2024 |
|
|
- |
|
|
- |
|
|
- |
|
|
- |
|
|
- |
|
- |
|
- |
|
|||||
Todd Cravens |
|
|
2023 |
|
|
- |
|
|
- |
|
|
- |
|
|
$ |
863 |
|
|
- |
|
- |
|
$ |
863 |
|
|||
Todd Cravens |
|
|
2022 |
|
|
$ |
52,718 |
|
|
$ |
(67,659 |
) |
|
- |
|
|
$ |
(21,020 |
) |
|
- |
|
- |
|
$ |
(35,961 |
) |
|
NEO |
|
Year |
|
|
Reported Summary Compensation Table Total for PEO |
|
|
Deduct Reported Value of Equity Awards (a) |
|
|
Add Equity Award Adjustments (b) |
|
|
Compensation Actually Paid to Non-PEO |
|
|||||
Steven Kopjo |
|
|
2024 |
|
|
$ |
401,400 |
|
|
$ |
254,008 |
|
|
$ |
582,310 |
|
|
$ |
729,702 |
|
Steven Kopjo |
|
|
2023 |
|
|
- |
|
|
- |
|
|
- |
|
|
- |
|
||||
Steven Kopjo |
|
|
2022 |
|
|
- |
|
|
- |
|
|
- |
|
|
- |
|
||||
Harry Hagerty |
|
|
2024 |
|
|
$ |
291,058 |
|
|
- |
|
|
$ |
(29,750 |
) |
|
$ |
261,308 |
|
|
Harry Hagerty |
|
|
2023 |
|
|
$ |
322,173 |
|
|
- |
|
|
$ |
(45,733 |
) |
|
$ |
276,440 |
|
|
Harry Hagerty |
|
|
2022 |
|
|
$ |
823,146 |
|
|
$ |
404,375 |
|
|
$ |
199,897 |
|
|
$ |
618,668 |
|
NEO |
|
Year |
|
|
Year End Fair Value of Outstanding and Unvested Equity Awards Granted in the Year |
|
|
Change in Fair Value as of the End of the Year of Outstanding and Unvested Equity Awards Granted in Prior Years |
|
|
Fair Value as of Vesting Date of Equity Awards Granted and Vested in the Year |
|
Change in Fair Value as of the Vesting Date of Equity Awards Granted in Prior Years that Vested in the Year |
|
|
Fair Value at the End of the Prior Year of Equity Awards that Failed to Meet Vesting Conditions in the Year |
|
Value of Dividends of or other Earnings Paid on Stock or Option Awards not Otherwise Reflected in Fair Value |
|
Total Equity Award Adjustments |
|
|||||
Steven Kopjo |
|
|
2024 |
|
|
$ |
582,310 |
|
|
- |
|
|
- |
|
- |
|
|
- |
|
- |
|
$ |
582,310 |
|
||
Steven Kopjo |
|
|
2023 |
|
|
- |
|
|
- |
|
|
- |
|
- |
|
|
- |
|
- |
|
- |
|
||||
Steven Kopjo |
|
|
2022 |
|
|
- |
|
|
- |
|
|
- |
|
- |
|
|
- |
|
- |
|
- |
|
||||
Harry Hagerty |
|
|
2024 |
|
|
- |
|
|
- |
|
|
- |
|
$ |
(29,750 |
) |
|
- |
|
- |
|
$ |
(29,750 |
) |
||
Harry Hagerty |
|
|
2023 |
|
|
- |
|
|
$ |
(39,967 |
) |
|
- |
|
$ |
(5,766 |
) |
|
- |
|
- |
|
$ |
(45,733 |
) |
|
Harry Hagerty |
|
|
2022 |
|
|
$ |
178,416 |
|
|
- |
|
|
- |
|
$ |
21,481 |
|
|
- |
|
- |
|
$ |
199,897 |
|
|
49
Required Disclosure of the Relationship Between Compensation Actually Paid and Financial Performance Measures
As required by Item 402(v) of Regulation S-K, we are providing the following graphs to illustrate the relationship between the pay and performance figures that are included in the pay versus performance tabular disclosure above. The graphs below reflect the relationship of compensation actually paid, from the tables above, to our PEO and Non-PEO NEOs in 2024, 2023 and 2022 to (1) total shareholder return, (2) Net Income (loss) and (3) Adjusted EBITDA. As noted above, compensation actually paid for purposes of the tabular disclosure and the following graphs was calculated in accordance with SEC rules and does not reflect the amount of compensation earned by or actually paid to our NEOs during the applicable years.
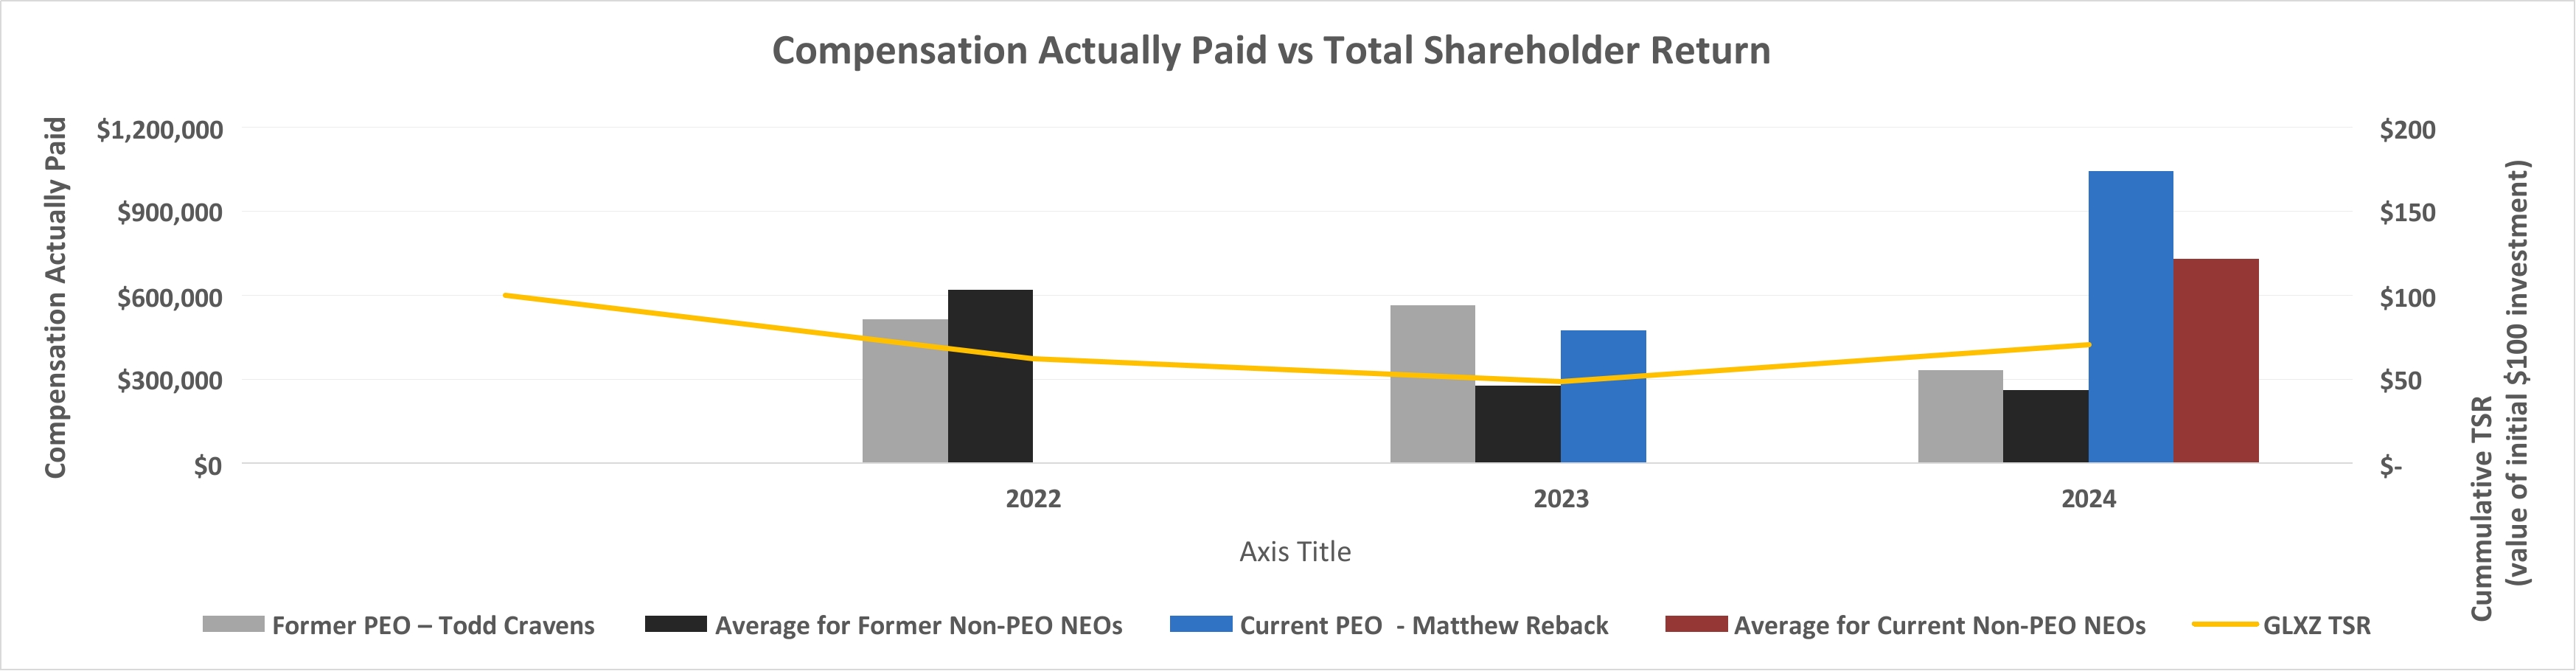
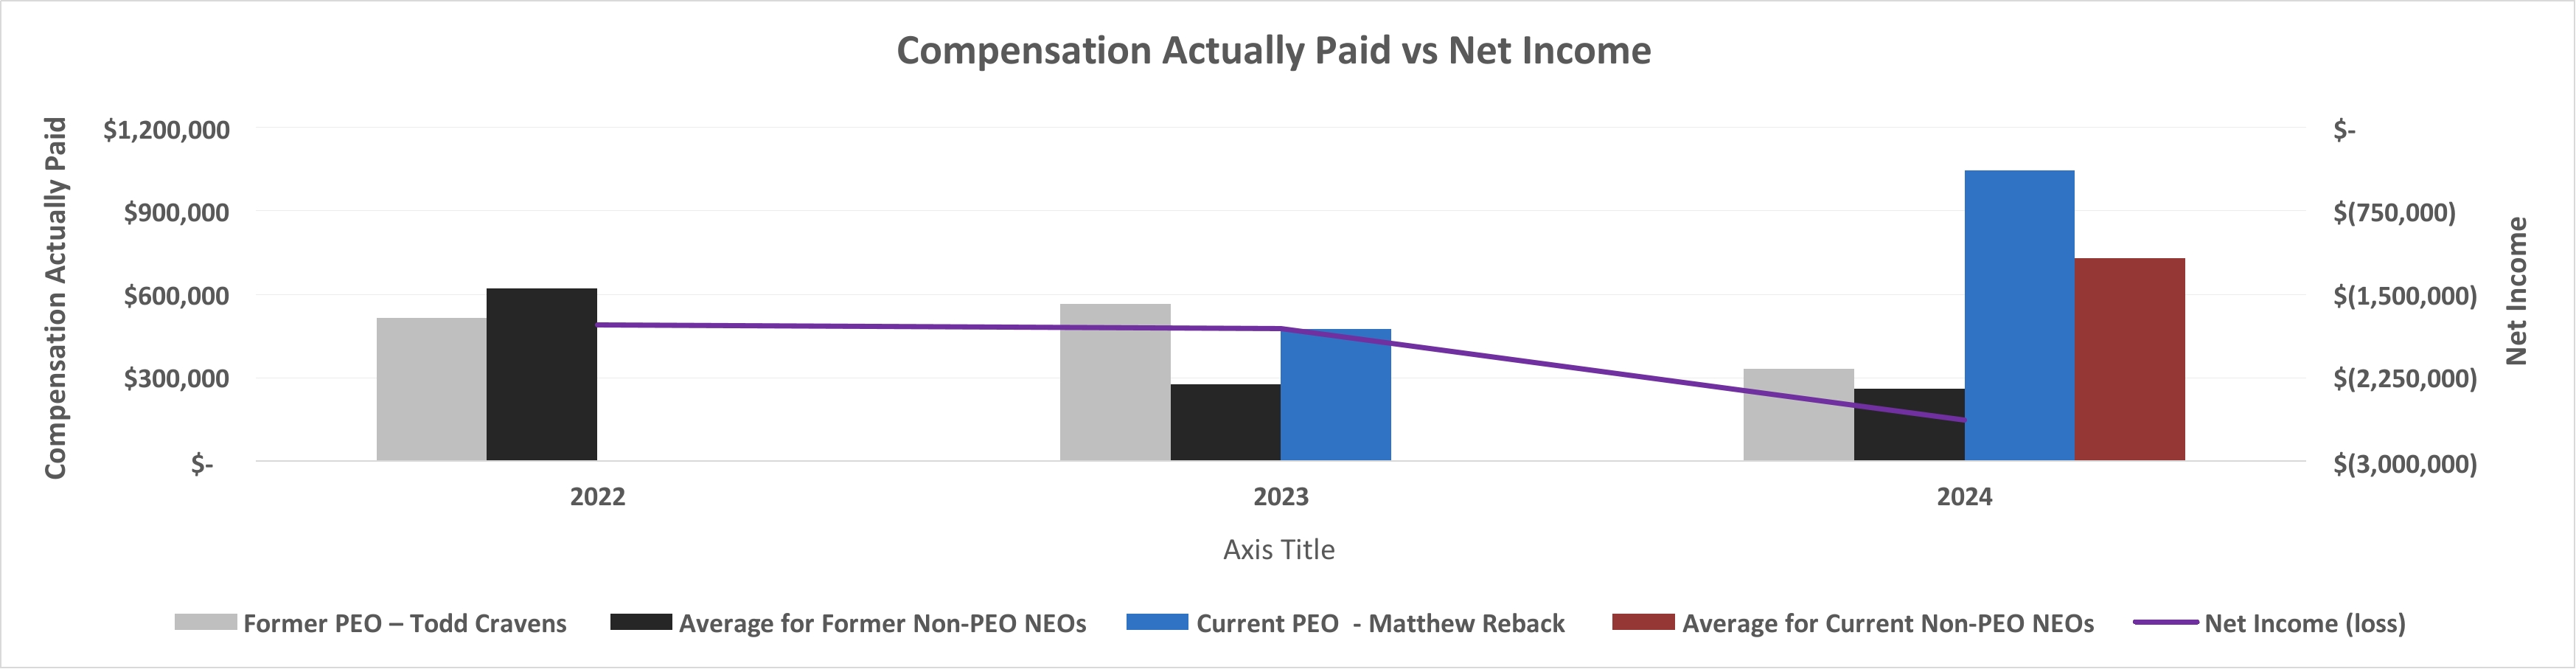
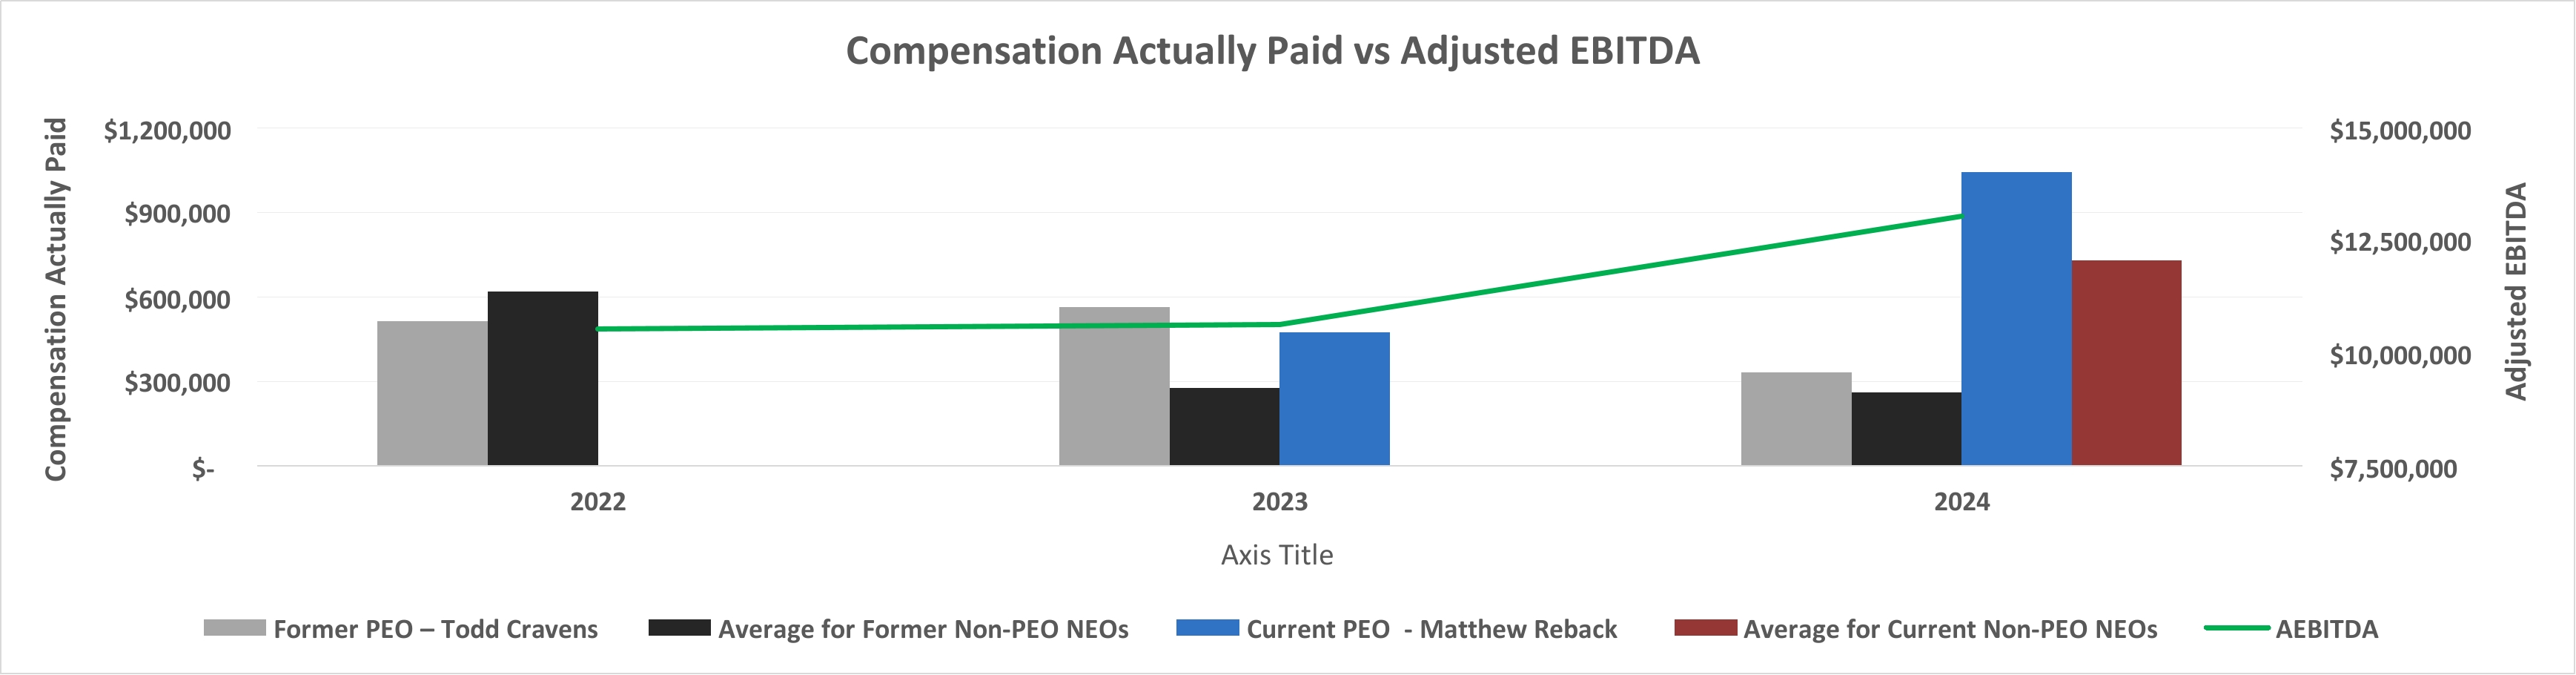
ITEM 12. SECURITY OWNERSHIP OF CERTAIN BENEFICIAL OWNERS AND MANAGEMENT, AND RELATED STOCKHOLDER MATTERS
The following table sets forth, as of February 28, 2025, the beneficial ownership of our common stock by each executive officer and director, by each person known by us to beneficially own more than 5% of our common stock and by the executive officers and directors as a group. Unless otherwise indicated, the named persons possess sole voting and investment power with respect to the shares listed (except to the extent such authority is shared with spouses under applicable law). The percentages are based upon a total of 25,415,299 shares as of February 28, 2025, consisting of 25,115,299 shares outstanding and 300,000 stock options and restricted stock, which are exercisable at February 28, 2025 or within 60 days.
50
Name of Beneficial Owner |
|
Amount of |
|
|
Percent of Class |
|
||
Mark A. Lipparelli, Director(1) |
|
|
2,007,289 |
|
|
|
7.90 |
% |
Michael Gavin Isaacs, Former Director |
|
|
311,500 |
|
|
|
1.23 |
% |
Meredith Brill, Director(2) |
|
|
403,570 |
|
|
|
1.59 |
% |
Bryan W. Waters, Director |
|
|
598,378 |
|
|
|
2.35 |
% |
Cheryl A. Kondra, Director |
|
|
156,243 |
|
|
|
0.61 |
% |
Matthew D. Reback, President and Chief Executive Officer(3) |
|
|
170,000 |
|
|
|
0.67 |
% |
Steven J. Kopjo, Chief Financial Officer(4) |
|
|
- |
|
|
|
0.00 |
% |
Total Current Directors and Executive Officers as a Group |
|
|
3,646,980 |
|
|
|
14.35 |
% |
Todd P. Cravens, Former President and Chief Executive Officer |
|
|
685,220 |
|
|
|
2.70 |
% |
Harry C. Hagerty, Former Chief Financial Officer(5) |
|
|
1,090,500 |
|
|
|
4.29 |
% |
Cannell Capital LLC(6) |
|
|
1,698,680 |
|
|
|
6.68 |
% |
Topline Capital Partners, LP(7) |
|
|
2,177,291 |
|
|
|
8.57 |
% |
ITEM 13. CERTAIN RELATIONSHIPS AND RELATED TRANSACTIONS, AND DIRECTOR INDEPENDENCE
Except as disclosed in the definitive proxy statement related to the merger that was filed by us with the SEC on September 26, 2024, none of our directors or executive officers, nor any proposed nominee for election as a director, nor any person who beneficially owns, directly or indirectly, shares carrying more than 5% of the voting rights attached to all of our outstanding shares, nor any members of the immediate family (including spouse, parents, children, siblings, and in-laws) of any of the foregoing persons has any material interest, direct or indirect, in any transaction over the last two years or in any presently proposed transaction which, in either case, has or will materially affect us.
We are not a “listed issuer” within the meaning of Item 407 of Regulation S-K. Applying the definition of independence set forth in Rule 4200(a)(15) of The Nasdaq Stock Market, Inc., we have determined all of our directors are independent directors.
ITEM 14. PRINCIPAL ACCOUNTING FEES AND SERVICES
Below is the table of audit fees billed by our auditor in connection with the audit of our annual financial statements for the years ended December 31:
Fee Type |
|
2024 |
|
|
2023 |
|
||
Audit fees |
|
$ |
418,075 |
|
|
$ |
353,414 |
|
Tax fees |
|
|
— |
|
|
|
— |
|
All other fees |
|
|
— |
|
|
|
— |
|
Total fees |
|
$ |
418,075 |
|
|
$ |
353,414 |
|
51
The Audit Fees listed above were billed in connection with the audit of our annual consolidated financial statements and the reviews of our interim consolidated financial statements included in our quarterly reports on Form 10-Q.
All of the fees set forth in the table above were pre-approved by the Audit Committee of the Board.
52
PART IV
ITEM 15. EXHIBITS AND FINANCIAL STATEMENT SCHEDULES
Exhibit Number |
|
Description |
Form |
File No. |
Exhibit |
Filing Date |
Filed Herewith |
|
|
|
|
|
|
|
|
2.1 |
|
8-K |
000-30653 |
2.1 |
July 18, 2024 |
|
|
|
|
|
|
|
|
|
|
3.1 |
|
8-K |
000-30653 |
3.1 |
February 13, 2009 |
|
|
|
|
|
|
|
|
|
|
3.2 |
|
8-K |
000-30653 |
3.2 |
February 13, 2009 |
|
|
|
|
|
|
|
|
|
|
3.3 |
|
8-K |
000-30653 |
3.2 |
February 14, 2020 |
|
|
|
|
|
|
|
|
|
|
10.1 |
|
Lease agreement with Abyss Group, LLC for 6980 O’Bannon Drive (related party) |
10-K |
000-30653 |
10.2 |
April 1, 2013 |
|
|
|
|
|
|
|
|
|
10.2 |
|
Amendment to lease agreement with Abyss Group, LLC for 6980 O’Bannon Drive (related party) |
10-K |
000-30653 |
10.3 |
April 1, 2013 |
|
|
|
|
|
|
|
|
|
10.3 |
|
Exclusive Operating and License Agreement with TableMAX Gaming, Inc. |
8-K |
000-30653 |
99.2 |
February 24, 2011 |
|
|
|
|
|
|
|
|
|
10.4 |
|
8-K |
000-30653 |
10.1 |
October 11, 2011 |
|
|
|
|
|
|
|
|
|
|
10.5 |
|
Prime Table Games Promissory Note and Security Agreement - US |
8-K |
000-30653 |
10.2 |
October 11, 2011 |
|
|
|
|
|
|
|
|
|
10.6 |
|
Prime Table Games Promissory Note and Security Agreement - UK |
8-K |
000-30653 |
10.3 |
October 11, 2011 |
|
|
|
|
|
|
|
|
|
10.7 |
|
Board of Directors Service Agreement with Bryan W. Waters, Director |
10-K |
000-30653 |
10.11 |
March 31, 2015 |
|
|
|
|
|
|
|
|
|
10.8 |
|
Employment agreement with Harry C. Hagerty, Chief Financial Officer, dated May 1, 2017 |
10-Q |
000-30653 |
10.1 |
May 15, 2017 |
|
|
|
|
|
|
|
|
|
10.9 |
|
10-Q |
000-30653 |
10.1 |
August 14, 2017 |
|
|
|
|
|
|
|
|
|
|
10.10 |
|
10-Q |
000-30653 |
99.1 |
May 16, 2016 |
|
|
|
|
|
|
|
|
|
|
10.11 |
|
10-Q |
000-30653 |
99.2 |
May 16, 2016 |
|
|
|
|
|
|
|
|
|
|
10.12 |
|
10-Q |
000-30653 |
99.3 |
May 16, 2016 |
|
|
|
|
|
|
|
|
|
|
10.13 |
|
10-Q |
000-30653 |
99.4 |
May 16, 2016 |
|
|
|
|
|
|
|
|
|
|
10.14 |
|
Settlement Agreement with Red Card Gaming, Inc. and AGS, LLC |
8-K |
000-30653 |
99.1 |
July 13, 2016 |
|
|
|
|
|
|
|
|
|
10.15 |
|
8-K/A |
000-30653 |
99.1 |
August 30, 2016 |
|
|
|
|
|
|
|
|
|
|
10.16 |
|
8-K/A |
000-30653 |
99.2 |
August 30, 2016 |
|
|
|
|
|
|
|
|
|
|
10.17 |
|
8-K/A |
000-30653 |
99.3 |
August 30, 2016 |
|
|
|
|
|
|
|
|
|
|
10.18 |
|
Gary Vecchiarelli Indemnification Agreement dated November 14, 2015 |
10-Q |
000-30653 |
99.3 |
November 16, 2015 |
|
|
|
|
|
|
|
|
|
10.19 |
|
10-K |
000-30653 |
10.5 |
April 2, 2018 |
|
|
|
|
|
|
|
|
|
|
10.20 |
|
Board of Directors Service Agreement with Mark A. Lipparelli |
8-K |
000-30653 |
99.1 |
September 7, 2017 |
|
|
|
|
|
|
|
|
|
10.21 |
|
Form of Voting and Control Agreement (Triangulum Partners, LLC shares) |
8-K |
000-30653 |
99.1 |
September 27, 2017 |
|
|
|
|
|
|
|
|
|
53
54
10.45 |
|
Severance Agreement dated November 10, 2023, between the Company and Todd Cravens |
8-K |
000-30653 |
10.1 |
November 20, 2023 |
|
|
|
|
|
|
|
|
|
10.46 |
|
Employment Agreement Dated May 22, 2024, between the Company and Steven Kopjo |
8-K |
000-30653 |
10.1 |
May 24, 2024 |
|
|
|
|
|
|
|
|
|
10.47 |
|
8-K |
000-30653 |
10.1 |
July 18, 2024 |
|
|
|
|
|
|
|
|
|
|
10.48 |
|
Form of Indemnification Agreement dated July 31, 2024, between the Company and Matt Reback |
8-K |
000-30653 |
10.1 |
August 5, 2024 |
|
|
|
|
|
|
|
|
|
10.49 |
|
Form of Indemnification Agreement dated July 31, 2024, between the Company and Steven Kopjo |
8-K |
000-30653 |
10.2 |
August 5, 2024 |
|
|
|
|
|
|
|
|
|
10.50 |
|
Amendment to Employment Agreement with Matt Reback dated December 27, 2024 |
8-K |
000-30653 |
10.2 |
December 31, 2024 |
|
|
|
|
|
|
|
|
|
19.1 |
|
|
|
|
|
X |
|
|
|
|
|
|
|
|
|
23.1 |
|
Consent of Moss Adams LLP, Independent Registered Public Accounting Firm |
|
|
|
|
X |
|
|
|
|
|
|
|
|
31.1 |
|
|
|
|
|
X |
|
|
|
|
|
|
|
|
|
31.2 |
|
|
|
|
|
X |
|
|
|
|
|
|
|
|
|
32.1 |
|
|
|
|
|
X |
|
|
|
|
|
|
|
|
|
101.INS |
|
Inline XBRL Instance Document – the instance does not appear in the Interactive Data File because XBRL tags are embedded within the Inline XBRL document |
|
|
|
|
|
|
|
|
|
|
|
|
|
101.SCH |
|
Inline XBRL Taxonomy Extension Schema Document |
|
|
|
|
|
|
|
|
|
|
|
|
|
101.CAL |
|
Inline XBRL Taxonomy Extension Calculation Linkbase Document |
|
|
|
|
|
|
|
|
|
|
|
|
|
101.DEF |
|
Inline XBRL Taxonomy Extension Definition Linkbase Document |
|
|
|
|
|
|
|
|
|
|
|
|
|
101.LAB |
|
Inline XBRL Taxonomy Extension Label Linkbase Document |
|
|
|
|
|
|
|
|
|
|
|
|
|
101.PRE |
|
Inline XBRL Taxonomy Extension Presentation Linkbase Document |
|
|
|
|
|
|
|
|
|
|
|
|
|
104 |
|
Cover Page Interactive Data File (embedded within the Inline XBRL document |
|
|
|
|
|
55
SIGNATURES
Pursuant to the requirements of the Securities Exchange Act of 1934, the registrant has duly caused this report to be signed on its behalf by the undersigned thereunto duly authorized.
GALAXY GAMING, INC.
Date: |
|
March 21, 2025 |
||
|
|
|
||
|
|
By: |
|
/s/ MATTHEW REBACK |
|
|
|
|
Matthew Reback |
|
|
|
|
President and Chief Executive Officer |
|
|
|
|
(Principal Executive Officer) |
Date: |
|
March 21, 2025 |
||
|
|
|
||
|
|
By: |
|
/s/ STEVEN KOPJO |
|
|
|
|
Steven Kopjo |
|
|
|
|
Chief Financial Officer |
|
|
|
|
(Principal Financial Officer) |
Pursuant to the requirements of the Securities Exchange Act of 1934, this report has been signed below by the following persons on behalf of the registrant and in the capacities and on the dates indicated:
Signature |
|
Title |
|
Date |
/s/ MATTHEW REBACK |
|
President and Chief Executive Officer |
|
March 21, 2025 |
Matthew Reback |
|
(Principal Executive Officer) |
|
|
|
|
|
|
|
/s/ STEVEN KOPJO |
|
Chief Financial Officer |
|
March 21, 2025 |
Steven Kopjo |
|
(Principal Financial Officer) |
|
|
|
|
|
|
|
/s/ MARK A. LIPPARELLI |
|
Chairman of the Board of Directors |
|
March 21, 2025 |
Mark A. Lipparelli |
|
|
|
|
/s/ MEREDITH BRILL |
|
Director |
|
March 21, 2025 |
Meredith Brill
/s/ BRYAN W. WATERS |
|
Director |
|
March 21, 2025 |
Bryan W. Waters |
|
|
|
|
/s/ CHERYL A. KONDRA |
|
Director |
|
March 21, 2025 |
Cheryl A. Kondra |
|
|
|
|
56