
Exhibit 99.1
Galaxy Gaming Reports Q4 and Full Year 2022 Financial Results
LAS VEGAS, March 31, 2023 (GLOBE NEWSWIRE) -- Galaxy Gaming, Inc. (OTCQB: GLXZ), a developer and distributor of casino table games and enhanced systems for land-based casinos and iGaming content, announced today its financial results for the quarter and year ended December 31, 2022.
Financial Highlights
Q4 2022 vs. Q4 2021
Full Year 2022 vs. Full Year 2021
Balance Sheet Changes (vs. December 31, 2021)
Executive Comments
“In spite of the headwinds from exchange rates, interest rates and inflation rates, we had a solid quarter and ended 2022 on a good trajectory,” said Todd Cravens, Galaxy’s President and CEO. “At constant currency, revenues for both the quarter and the year would have been new records for Galaxy. We enter the current year with several new games coming to market, and we will be installing the first of our Galaxy Operating System (“GoS”) progressives beginning in Q2. We expect double-digit revenue increases in our online business in 2023, and expect revenue growth in the GG Core business to accelerate over the course of the year as GoS systems get installed, along with new content. We are working on upgrades and enhancements to GoS and expect to present GoS 2.0 at G2E in October.”
Exhibit 99.1
“Some adjustments need to be made to our reported numbers to make them more comparable to the respective 2021 figures,” said Harry Hagerty, Galaxy’s CFO. “For the quarter, using last year’s exchange rates adds $512K to revenue. Our Adjusted EBITDA in the quarter benefitted from $575K in ERTC credits, which should be removed for comparability. Applying both adjustments results in pro forma revenue of $6,453K (+14%) and pro forma EBITDA of $3,090K (+43%). For the year, using last year’s exchange rates adds $1,189K to revenue, and Adjusted EBITDA benefitted from the same $575K ERTC credit. Applying both adjustments results in pro forma revenue of $24,632K and pro forma EBITDA of $11,149K.
“The currency comparisons impacted in the GG Digital operating segment more than the GG Core segment. For the quarter, revenue in GG Core was $3,944K ($4,036 in constant currency) vs. $3,951k in Q4 2021. In GG Digital, we had revenues of $1,996 in Q4 2022 ($2,416 in constant currency) vs. $1,719 in Q4 2021. For the year, revenue in GG Core was $15,399K ($15,685K in constant currency) vs. $13,556k in 2021. In GG Digital, we had revenues of $8,043 in 2022 ($8,946 in constant currency) vs. $6,428in 2021.
“We are very comfortably in compliance with the Net Leverage covenant in our credit agreement with Fortress. Our Net Leverage was 4.0x at year-end vs. a maximum allowable of 8.0x (stepping down to 6.0x in 2023). The interest we pay on the term loan has increased sharply as short-term benchmarks increased over the last three quarters of 2022. We expect interest expense to be close to $9.0 million in 2023 based on a benchmark rate of 5.0% for the remainder of the year. We expect to generate Adjusted EBITDA in excess of interest expense and amortization in 2023, and we will also maintain significant cash balances in order to allow us to pay the interest and amortization if business trends deteriorate. We hope to be able to refinance the Fortress debt in Q4 2022 when the prepayment penalty lapses.
“For 2023, we are forecasting revenue in a range of $26-$27 million and Adjusted EBITDA in a range of $12-13 million. This forecast assumes exchange rates that existed in Q4 2022 and is based on economic conditions as they existed at the beginning of 2023.
“We have not repurchased any common stock under the authorization we received in November and will not be able to do any repurchases until after the current blackout period expires after the filing of our Q1 10-Q on May 15, 2023.”
The company is releasing an investor deck with its earnings this quarter. Investors are encouraged to send questions to management at investors@galaxygaming.com by Monday, April 3rd. Management will record their answers to investor questions and give more detail to the investor deck. The recording should be posted on or around April 7th.
Forward-Looking Statements
This press release contains, and oral statements made from time to time by our representatives may contain, forward-looking statements based on management's current expectations and projections, which are intended to qualify for the safe harbor of Section 27A of the Securities Act of 1933, as amended, and Section 21E of the Securities Exchange Act of 1934, as amended. Forward-looking statements include statements identified by words such as "believe," "will," "may," "might," "likely," "expect," "anticipates," "intends," "plans," "seeks," "estimates," "believes," "continues," "projects" and similar references to future periods, or by the inclusion of forecasts or projections.
Exhibit 99.1
All forward-looking statements are based on current expectations and projections of future events.
These forward-looking statements reflect the current views, models, and assumptions of Galaxy Gaming, and are subject to various risks and uncertainties that cannot be predicted or qualified and could cause actual results in Galaxy Gaming's performance to differ materially from those expressed or implied by such forward looking statements. These risks and uncertainties include, but are not limited to, the ability of Galaxy Gaming to enter and maintain strategic alliances, product placements or installations, in land based casinos or grow its iGaming business, garner new market share, secure licenses in new jurisdictions or maintain existing licenses, successfully develop or acquire and sell proprietary products, comply with regulations, have its games approved by relevant jurisdictions, and other factors. All forward-looking statements made herein are expressly qualified in their entirety by these cautionary statements and there can be no assurance that the actual results, events, or developments referenced herein will occur or be realized. Readers are cautioned that all forward-looking statements speak only to the facts and circumstances present as of the date of this press release. Galaxy Gaming expressly disclaims any obligation to update or revise any forward-looking statements, whether because of new information, future events or otherwise.
About Galaxy Gaming
Headquartered in Las Vegas, Nevada, Galaxy Gaming (galaxygaming.com) develops and distributes innovative proprietary table games, state-of-the-art electronic wagering platforms and enhanced bonusing systems to land-based, riverboat, and cruise ship and casinos worldwide. In addition, through its wholly owned subsidiary, Progressive Games Partners LLC, Galaxy licenses proprietary table games content to the online gaming industry. Connect with Galaxy on Facebook, YouTube and Twitter.
Non-GAAP Financial Information
Adjusted EBITDA includes adjustments to net loss/income to exclude interest, taxes, depreciation, amortization, share based compensation, gain/loss on extinguishment of debt, foreign currency exchange gains/losses, change in estimated fair value of interest rate swap liability and severance and other expenses related to litigation. Adjusted EBITDA is not a measure of performance defined in accordance with generally accepted accounting principles in the United States of America (“U.S. GAAP”). However, Adjusted EBITDA is used by management to evaluate our operating performance. Management believes that disclosure of Adjusted EBITDA allows investors, regulators, and other stakeholders to view of our operations in the way management does. Adjusted EBITDA should not be considered as an alternative to net income or to net cash provided by operating activities as a measure of operating results or of liquidity. Finally, Adjusted EBITDA may not be comparable to similarly titled measures used by other companies.
Revenue at constant currency is a non-GAAP measure. We calculate constant currency revenue by applying the exchange rates realized in the year-ago period to the revenue earned in the respective foreign currencies in the current period. We believe that providing constant currency revenue allows readers to better understand the underlying growth of our businesses by removing the effect of exchange rate changes. In calculating EBITDA pro forma for constant currency, we do not adjust the exchange rates for expenses in current periods as the majority of our expenses are denominated in US dollars.
Exhibit 99.1
Contact:
Media: Phylicia Middleton (702) 936-5216
Investors: Harry Hagerty (702) 938-1740
Exhibit 99.1
|
|
|
Years ended December 31, |
||||||||||
Adjusted EBITDA Reconciliation: |
|
|
2022 |
|
|
2021 |
|||||||
Net (loss) income |
|
|
$ |
(1,773,189 |
) |
|
$ |
2,111,812 |
|||||
Interest expense |
|
|
|
7,411,224 |
|
|
|
1,505,386 |
|||||
Share redemption consideration |
|
|
|
— |
|
|
|
682,469 |
|||||
Interest income |
|
|
|
(71,223 |
) |
|
|
(2,048) |
|||||
Depreciation and amortization |
|
|
|
2,761,359 |
|
|
|
2,858,991 |
|||||
Share-based compensation |
|
|
|
1,278,068 |
|
|
|
1,532,455 |
|||||
Foreign currency exchange loss (gain) |
|
|
|
290,394 |
|
|
|
64,879 |
|||||
Change in fair value of interest |
|
|
|
— |
|
|
|
(66,009) |
|||||
Provision (benefit) for income taxes |
|
|
|
208,887 |
|
|
|
48,637 |
|||||
Other non-recurring income |
|
|
|
5,709 |
|
|
|
— |
|||||
Severance expense |
|
|
|
28,477 |
|
|
|
12,596 |
|||||
Special project expense (benefit) - Triangulum |
|
|
|
(86,959 |
) |
|
|
487,712 |
|||||
Special project expense - Other |
|
|
|
481,737 |
|
|
|
(503,050) |
|||||
Adjusted EBITDA |
|
|
$ |
10,534,484 |
|
|
$ |
8,733,830 |
|||||
|
|
Three Months Ended December 31, |
|||||||||||
Adjusted EBITDA Reconciliation: |
|
2022 |
|
2021 |
|||||||||
Net (loss) income |
|
$ |
55,105 |
|
$ |
623,384 |
|||||||
Interest expense |
|
2,129,902 |
|
1,054,912 |
|||||||||
Share redemption consideration |
|
— |
|
96,023 |
|||||||||
Interest income |
|
(48,057) |
|
(886) |
|||||||||
Depreciation and amortization |
|
571,570 |
|
698,774 |
|||||||||
Share-based compensation |
|
323,518 |
|
324,807 |
|||||||||
Foreign currency exchange loss (gain) |
|
(199,647) |
|
33,478 |
|||||||||
Provision (benefit) for income taxes |
|
310,828 |
|
41,637 |
|||||||||
Other non-recurring income |
|
(12,546) |
|
(25,000) |
|||||||||
Special project expense (benefit) - Triangulum |
|
— |
|
74,688 |
|||||||||
Special project expense - Other |
|
21,833 |
|
(490,676) |
|||||||||
Exhibit 99.1
Adjusted EBITDA |
|
$ |
3,152,505 |
|
$ |
2,431,141 |
Exhibit 99.1
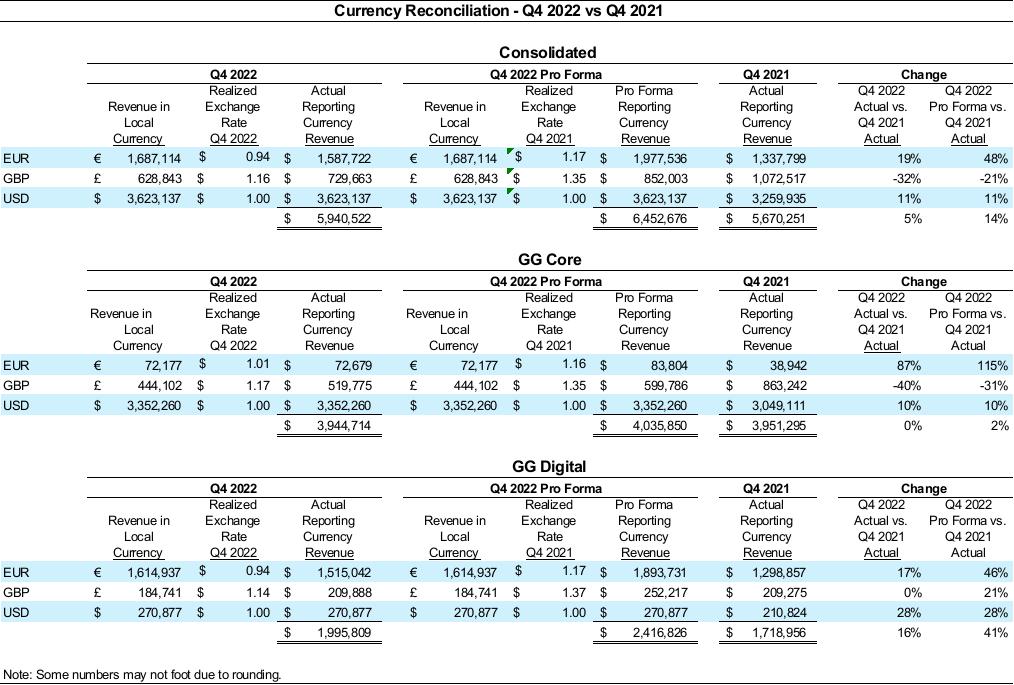
Exhibit 99.1
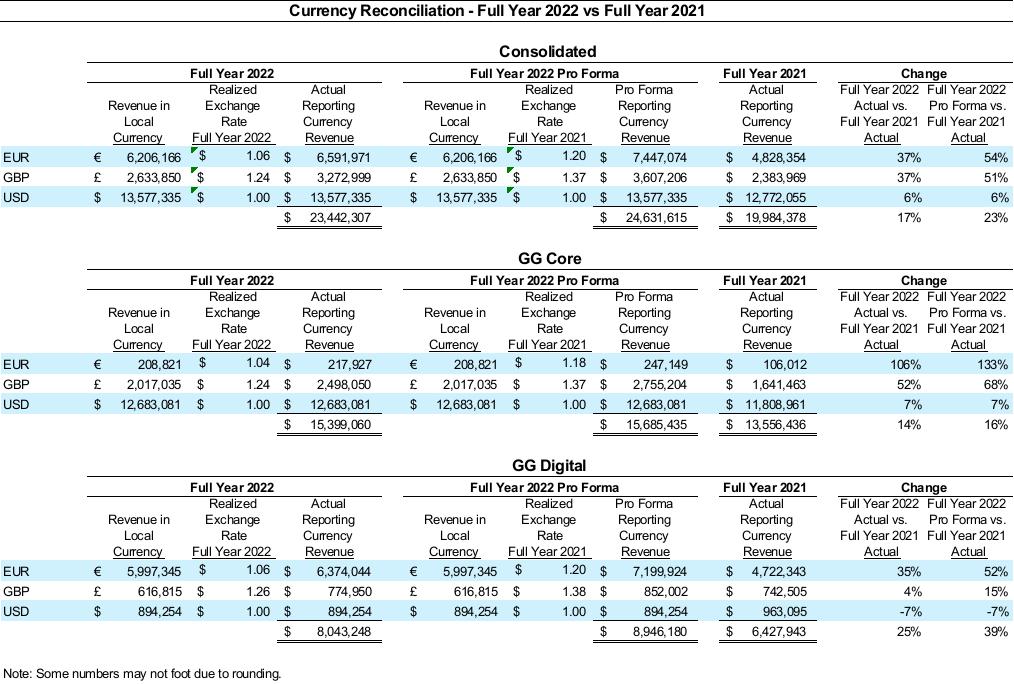
Exhibit 99.1
Exhibit 99.1